Feeds:
Posts
Comments

Archive for the ‘Net Current Asset Value’ Category

Last week I wrote about the performance of one of Benjamin Graham’s simple quantitative strategies over the 37 years he since he described it (Examining Benjamin Graham’s Record: Skill Or Luck?). In the original article Graham proposed two broad approaches, the second of which we examine in Quantitative Value: A Practitioner’s Guide to Automating Intelligent Investment and Eliminating Behavioral Errors. The first approach Graham detailed in the original 1934 edition of Security Analysis (my favorite edition)—“net current asset value”:

My first, more limited, technique confines itself to the purchase of common stocks at less than their working-capital value, or net-current asset value, giving no weight to the plant and other fixed assets, and deducting all liabilities in full from the current assets. We used this approach extensively in managing investment funds, and over a 30-odd year period we must have earned an average of some 20 per cent per year from this source. For a while, however, after the mid-1950’s, this brand of buying opportunity became very scarce because of the pervasive bull market. But it has returned in quantity since the 1973–74 decline. In January 1976 we counted over 300 such issues in the Standard & Poor’s Stock Guide—about 10 per cent of the total. I consider it a foolproof method of systematic investment—once again, not on the basis of individual results but in terms of the expectable group outcome.

In 2010 I examined the performance of Graham’s net current asset value strategy with Sunil Mohanty and Jeffrey Oxman of the University of St. Thomas. The resulting paper is embedded below:

While Graham found this strategy was “almost unfailingly dependable and satisfactory,” it was “severely limited in its application” because the stocks were too small and infrequently available. This is still the case today. There are several other problems with both of Graham’s strategies. In Quantitative Value: A Practitioner’s Guide to Automating Intelligent Investment and Eliminating Behavioral Errors Wes and I discuss in detail industry and academic research into a variety of improved fundamental value investing methods, and simple quantitative value investment strategies. We independently backtest each method, and strategy, and combine the best into a sample quantitative value investment model.

The book can be ordered from Wiley FinanceAmazon, or Barnes and Noble.

[I am an Amazon Affiliate and receive a small commission for the sale of any book purchased through this site.]

Read Full Post »

Zero Hedge has an article Buy Cash At A Discount: These Companies Have Negative Enterprise Value in which Tyler Durden argues that stock market manipulation has led to valuation dislocations, and gives as evidence the phenomenon of stocks trading with a negative enterprise value (EV):

With humans long gone from the trading arena and algorithms left solely in charge of the casino formerly known as “the stock market”, in which price discovery is purely a function of highly levered synthetic instruments such as ES and SPY or, worse, the EURUSD and not fundamentals, numerous valuation dislocations are bound to occur. Such as company equity value trading well below net cash (excluding total debt), or in other words, negative enterprise value, meaning one can buy the cash at a discount of par and assign zero value to all other corporate assets.

Just as the fact of your paranoia does not exclude the possibility that someone is following you*, you don’t need to believe in manipulation to believe that negative EV is a “valuation dislocation.” Negative EV stocks are often also Graham net nets or almost net nets, and so perform like net nets. For example, Turnkey Analyst took a look at the performance of negative EV stocks (click to enlarge):

Long story short: they ripped, but they were few (sometimes non-existent), and small (mostly micro), which means you would have been heavily concentrated in a few mostly very small stocks, and regularly carried a lot of cash. If you eliminated the tiniest (i.e. the smallest 10 or 20 percent), much of the return disappeared, and volatility spiked markedly. Says Wes:

A few key points:

  1. After you eliminate the micro-crap stocks, you end up being invested in a few names at a time (sometimes you go all-in on a single firm!)
  2. Sometimes the strategy isn’t invested.
  3. The amazing Bueffettesque returns for the “all firms” portfolio above are exclusively tied to micro-craps.

Here’s the frequency of negative EV opportunities according to Turnkey (click to enlarge):

No surprise, there were more following a crash (1987, 2001, 2009) and fewer at the peak (1986, 1999, 2007). If your universe eliminated the smallest 20 percent (the green line), you spent a lot of time in cash. If your universe was unrestricted (the red line), then you’d have had some prospects to mine most of the time. Clearly, it’s not an institutional-grade strategy, but it has worked for smaller sums.

Zero Hedge screened Russell 2000 companies finding 10 companies with negative enterprise value, and then further subdivided the screen into companies with negative, and positive free cash flow (defined here as EBITDA – Cap Ex). Here’s the list (click to enlarge):

Including short-term investments yields a bigger list (click to enlarge):

Like Graham net nets, negative EV stocks are ugly balance sheet plays. They lose money; they burn cash; the business, if they actually have one, usually needs to be taken to the woodshed (so does management, for that matter). Frankly, that’s why they’re cheap. Says Durden:

Typically negative EV companies are associated with pre-bankruptcy cases, usually involving large cash burn, in other words, where the cash may or may not be tomorrow, and which may or may not be able to satisfy all claims should the company file today, especially if it has some off balance sheet liabilities.

You can cherry-pick this screen or buy the basket. I favor the basket approach. Just for fun, I’ve formed four virtual portfolios at Tickerspy to track the performance:

  1. Zero Hedge Negative Enterprise Value Portfolio
  2. Zero Hedge Negative Enterprise Value Portfolio (Positive FCF Only)
  3. Zero Hedge Negative Enterprise Value (Inc. Short-Term Investments) Portfolio
  4. Zero Hedge Negative Enterprise Value (Inc. Short-Term Investments) Portfolio (Positive FCF Only)

I’ll check back in occasionally to see how they’re doing. My predictions for 2013:

  1. All portfolios beat the market
  2. Portfolio 1 outperforms Portfolio 2 (i.e. all negative EV stocks outperform those with positive FCF only)
  3. Portfolio 3 outperforms Portfolio 4 for the same reason that 1 outperforms 2.
  4. Portfolios 1 and 2 outperform Portfolios 3 and 4 (pure negative EV stocks outperform negative EV including short-term investments)

Take care here. The idiosyncratic risk here is huge because the portfolios are so small. Any bump to one stock leaves a huge hole in the portfolio.

* Turn around. I’m right behind you.

Read Full Post »

Wes Gray’s Turnkey Analyst has a guest post from Paul Sepulveda in which Paul  asks if it’s possible to improve net net returns by removing stocks with the highest risk of going to zero (the real losers).

Paul has an interesting approach:

My goal was to chop off the left tail of the distribution of returns. Piotroski uses his F-Score to achieve a similar goal among a universe of firms with low P/B (i.e., “value” firms). After collecting the data on recent net-net “cigar-butts”, I quickly realized something: about half of my list consisted of Chinese reverse-merger companies! These firms definitely had a decent shot of going to zero after shareholders realized Bernie Madoff was the CEO and Arthur Anderson was performing the audit work. I separated these companies from the remaining universe. For completeness, I also recorded market caps and Piotroski scores to create alternative net-net universes I could study.

Here are his results:

Paul has only six months of data, but the experiment is ongoing. He has some other interesting observations. See the rest of the post here.

Read Full Post »

Oozing Alpha has a write-up on the valuation of Aviat Networks, Inc. (NASDAQ:AVNW) (see the post archive here). AVNW is an interesting Ramius activist target trading at a small premium to net current asset value. Here’s the write-up from Oozing Alpha:

Investment Thesis
AVNW is an excellent opportunity to invest in a leading wireless backhaul producer at 19% EV/Sales and below tangible book value, while backhaul traffic continues to grow rapidly, bookings have bottomed and North American business activity begins to pick up.

AVNW has a very overcapitalized balance sheet with $137mm of net cash ($2.30/share) as of 6/30, a returning CEO who has tremendous knowledge and background in the business, and a new cost cutting program that will boost operating margins inline with business conditions and yield sustainable profitability at current trough revenue levels. Not to mention a recently announced active 6% shareholder Ramius, which outlines the opportunity well in a recent 13D filing.

I believe an investment in AVNW today has very little downside risk and 100%+ upside potential over next 1-2 years. Last night’s quarterly results and large guidance range for next quarter may provide a great entry point tomorrow.

Business
Developed market wireless subscriber growth appears to have stalled, but developing markets are growing rapidly and in many cases, the entire telecom infrastructure is wireless, providing a nice tailwind for Aviat. The keys for Aviat are new network placements and add on capacity as backhaul bottlenecks continue to occur globally.

60% of Aviat’s revenue is outside of North America currently, with Africa revenue being volatile the last 23 years as only 2 real customers historically and consolidation of carriers has hurt Aviat. Europe is having problems and it appears both it and Africa are currently losing money in their operations. Russia activity is picking up and is a key region for AVNW. Asia Pac continues to grow and management is optimistic in its future and ability to generate sound profitability, albeit exact margins there now are tough to determine.

The 10k breaks out North America vs. International operators and it appears N.A is breakeven, but a lot of costs associated with N.A. are really International given AVNW is based in CA and a lot of corporate costs associated with running the International ops are baked into the N.A. #s. Tough to say how much but management acknowledges this issue.

The general consensus is networks are moving rapidly to 4G/LTE, however, in reality Aviat believes there still exists a very large market for TDM/3G equipment, as voice uptime is more critical than data uptime. Aviat is very strong in TDM and will continue to leverage this as they build out there 4G/WIMAX abilities, given backhaul networks require more and more traffic provisioning cellular base station traffic is up 10 fold in 3 years and expected to double every 2 years, according to Yankee Group.

There is quite a bit of competition in this area with Ceragon and Dragonwave being 2 pure play comps and obviously Ericsson and Alcatel/Lucent. Ceragon is a very good competitor with strong product portfolio and have been aggressively recruiting Aviat personnel, especially in sales. Huawei in Taiwan has been a thorn in the industry’s side so to speak as Bank of China has offered them absurd financing and Huawei is financing their sales at or below cost, trying to capture market share. It has hurt industry pricing but can’t last forever.

Customers are aware of this and continue to want multiple vendors. Generally customers seem happy with Aviat (candidly, have only talked to 2 and most feedback is from analyst community), continue to require multiple vendors and Aviat should get a nice share of the market going forward given its strong customer list, global footprint and competitive product portfolio.

The new CEO Chuck Kissner was the CEO of Stratex Networks and due diligence on him over the last few weeks has come back pretty positive. He seems to be a no nonsense guy who realized the cost structure was too bloated for current business conditions and has an aggressive plan in place to adjust it the next few months. He has been there a month but knows from the board level that many investors were fed up with Harold’s growth ambitions that weren’t in sync with customer’s spending plans and the overall economic environment.

Recent changes
New strategic plan highlights and cost cutting program, per last night’s release and conference call:

* Focus on wireless transmission and their microwave backhaul solutions, where they have a strong presence and portfolio.
* Make WIMAX part of the wireless product offering, not a separate business.
* Expand its service businesses network mgmt, design, implementation.
* Achieve profitability on current revenue run rate levels of $110-120mm per quarter.
– Reduce overall cost structure by $30-35mm annually; $6-8mm per quarter in SG&A and rest in COGS through manufacturing efficiencies.

The company took major charges this quarter and made it a kitchen sink quarter dropped intangibles $71mm and PP&E $10mm, sold TX manufacturing facility, announced plans to close Raleigh facility and are moving to a 100% outsourced manufacturing model. D&A will drop $12mm annually as a result. Moved to Santa Clara will save $1.5mm annually, took $2mm of cash to do it however but still a smart move.

Company produced $28.3mm of operating cash flow in FY2010 (June), lower than previous years but decent given poor operating performance and bloated cost structure.

$10-12mm of cash will be burned to complete this restructuring, mainly over next 2 quarters. Gross margins will be weak in the 1Q due to scrap inventory charge on India WIMAX equipment, but will return to 32-33% range by 2H. If not for this charge, GM%would be up nventory charge on India WIMAX equipment, but will return to 32-33% range by 2H. If not for this charge, GM% would be up QoQ over last quarter. OPEX was $43mm last quarter and will be down $6-7mm by Q311 (3/31/11).

Worst case, if not turned around and successful by end of next year, I see 2 scenarios:

1) Deemphasize WIMAX altogether and shun Telsima acquisition operations, focus purely on TDM/3G microwave business that continues to be the core and most successful product offering, thereby reducing costs even further; or

2) Close down Africa and Europe, focus on North America and AsiaPac, dramatically reducing cost structure and running a 10% EBIT margin, albeit on $250-300mm of revenue. Less growth prospects, but highly profitable. This is a drastic move and most likely wouldn’t happen until 2012. Shareholder pressure may also cause this or a cleanup of the business to dress it up for a sale to strategic. Private equity would also be interested, especially today, but shareholders wouldn’t be rewarded enough as private equity would want the upside of the cost cuts and restructuring.

Balance sheet/Liquidity
Pristine condition with $137mm of net cash, $189mm of net working capital (current asset minus total liab) and $80mm untapped credit facility.

Buyback would be a good use of cash and board has considered it, as well as tuck in acquisitions, but neither is in the cards for now until business turns and cost structure is reset. If stock doesn’t respond in a reasonable amount of time, I fully expect the board to feel pressure to consider a sale to either a strategic like Juniper or Cisco, or to private equity worst case, both of which should be at nice premiums to today’s quote.

Valuation
$500mm revenue business with 33-35% gross margins and nice medium-long term prospects for $90mm enterprise value. Stock has traded on balance sheet value principally the last few months and appears to have bottomed.

Once cost cutting is complete and assuming revenue stays flat, AVNW should do $40-50mm of EBITDA on $450-500mm in revenue. Did $20mm on $479mm last year, plus $30-35mm of cost reductions. This would be conservative as management fully expects to grow revenue in the future given backhaul traffic growth and excellent microwave product portfolio and R&D team.

At 6x, $270mm EV would yield $6.62/share. That is my base case. D&A will be down $12mm annually so I am assuming $25mm in annual D&A and $15mm of annual capex, and 25% tax rate. At $45mm in EBITDA, that would be $15mm in net income, or $.25/share, and $25mm in FCF or $.42/share.

Please see below comp chart with Ceragon and Dragonwave. Ceragon is a better comp as Dragonwave is principally a WIMAX business even thought they are focused on expanding. DRWI blew up recently as its main customer Clearwire cut back its growth capex.

{My note: The table presented in the write-up is really “busy” and unreadable. Instead, just look up the EV/2010 Estimated EBITDA multiples of the two comps, CRNT and DRWI, on FirstCall. CRNT is trading at 12x and DRWI at 10x.}

Risks
* Bookings remain soft in Africa and N.A. doesn’t turn.
* Cost cutting cuts muscle, not just fat, hurting product portfolio, performance and company’s reputation.
* Huawei continues to take share with unprofitable bids.
* Continued pushout of deal closings and supply shortages causes further revenue weakness below $110-120mm quarterly.

Catalyst:
* Achieving cost cutting program in size and on target, generating profitable quarters once again.
* Bookings and revenue growth return.
* Market recognizes turnaround and growth potential, assigning a reasonable earnings and sales multiple.

Long AVNW.

Read Full Post »

This is an oldie, but a goodie (via CNN). The travails of buying net nets, as told by the master’s apprentice:

Warren Buffett says Berkshire Hathaway is the “dumbest” stock he ever bought.

He calls his 1964 decision to buy the textile company a $200 billion dollar blunder, sparked by a spiteful urge to retaliate against the CEO who tried to “chisel” Buffett out of an eighth of a point on a tender deal.

Buffett tells the story in response to a question from CNBC’s Becky Quick for a Squawk Box series on the biggest self-admitted mistakes by some of the world’s most successful investors.

Buffett tells Becky that his holding company (presumably with a different name) would be “worth twice as much as it is now” — another $200 billion — if he had bought a good insurance company instead of dumping so much money into the dying textile business.

Here’s his story:

BUFFETT:  The— the dumbest stock I ever bought— was— drum roll here— Berkshire Hathaway.  And— that may require a bit of explanation.  It was early in— 1962, and I was running a small partnership, about seven million.  They call it a hedge fund now.

And here was this cheap stock, cheap by working capital standards or so.  But it was a stock in a— in a textile company that had been going downhill for years.  So it was a huge company originally, and they kept closing one mill after another.  And every time they would close a mill, they would— take the proceeds and they would buy in their stock.  And I figured they were gonna close, they only had a few mills left, but that they would close another one.  I’d buy the stock.  I’d tender it to them and make a small profit.

So I started buying the stock.  And in 1964, we had quite a bit of stock.  And I went back and visited the management,  Mr. (Seabury) Stanton.  And he looked at me and he said, ‘Mr. Buffett.  We’ve just sold some mills.  We got some excess money.  We’re gonna have a tender offer.  And at what price will you tender your stock?’

And I said, ‘11.50.’  And he said, ‘Do you promise me that you’ll tender it 11.50?’  And I said, ‘Mr. Stanton, you have my word that if you do it here in the near future, that I will sell my stock to— at 11.50.’  I went back to Omaha.  And a few weeks later, I opened the mail—

BECKY:  Oh, you have this?

BUFFETT:   And here it is:  a tender offer from Berkshire Hathaway— that’s from 1964.  And if you look carefully, you’ll see the price is—

BECKY:  11 and—

BUFFETT:   —11 and three-eighths.  He chiseled me for an eighth.  And if that letter had come through with 11 and a half, I would have tendered my stock.  But this made me mad.  So I went out and started buying the stock, and I bought control of the company, and fired Mr. Stanton.  (LAUGHTER)

Now, that sounds like a great little morality table— tale at this point.  But the truth is I had now committed a major amount of money to a terrible business.  And Berkshire Hathaway became the base for everything pretty much that I’ve done since.  So in 1967, when a good insurance company came along, I bought it for Berkshire Hathaway.  I really should— should have bought it for a new entity.

Because Berkshire Hathaway was carrying this anchor, all these textile assets.  So initially, it was all textile assets that weren’t any good.  And then, gradually, we built more things on to it.  But always, we were carrying this anchor.  And for 20 years, I fought the textile business before I gave up.  As instead of putting that money into the textile business originally, we just started out with the insurance company, Berkshire would be worth twice as much as it is now.  So—

BECKY:  Twice as much?

BUFFETT:  Yeah.  This is $200 billion.  You can— you can figure that— comes about.  Because the genius here thought he could run a textile business. (LAUGHTER)

BECKY:  Why $200 billion?

BUFFETT:  Well, because if you look at taking that same money that I put into the textile business and just putting it into the insurance business, and starting from there, we would have had a company that— because all of this money was a drag.  I mean, we had to— a net worth of $20 million.  And Berkshire Hathaway was earning nothing, year after year after year after year.  And— so there you have it, the story of— a $200 billion— incidentally, if you come back in ten years, I may have one that’s even worse.  (LAUGHTER)

Hat tip SD and David Lau.

Read Full Post »

Charlie Rose has a fantastic interview with Wilbur Ross, who played Willy Tanner (the dad) on Alf before becoming an investor in distressed businesses, most notably in the coal, steel and auto parts industries. This profile describes Ross’s start thus:

In 2001, when LTV, a bankrupt steel company based in Cleveland, decided to liquidate, Ross was the only bidder. Ross suspected that President Bush, a free trader, would soon enact steel tariffs on foreign steel, the better to appeal to prospective voters in midwestern swing states. So in February 2002, Ross organized International Steel Group and agreed to buy LTV’s remnants for $325 million. A few weeks later, Bush slapped a 30 percent tariff on many types of imported steel—a huge gift. “I had read the International Trade Commission report, and it seemed like it was going to happen,” said Ross. “We talked to everyone in Washington.” (Ross is on the board of News Communications, which publishes The Hill in Washington, D.C.)

With the furnaces rekindled, LTV’s employees returned to the job, but under new work rules and with 401(k)s instead of pensions. A year later, Ross performed the same drill on busted behemoth Bethlehem Steel. Meanwhile, between the tariffs, China’s suddenly insatiable demand for steel, and the U.S. automakers’ zero-percent financing push, American steel was suddenly red hot. The price per ton of rolled steel soared, and in a career-making turnaround, Ross took ISG public in December 2003.

After pulling off a quick turnaround in the twentieth century’s iconic business—steel—Ross set about doing the same with the troubled iconic industry of the nineteenth century. In October 2003, he outdueled Warren Buffett for control of Burlington Industries, a large textile company that failed in late 2001. In March 2004, he snapped up Cone Mills, which, like Burlington, was based in Greensboro, North Carolina, and bankrupt. As with the steel companies, the PBGC took over some of the pensions, the unions made concessions, and thousands of laid-off workers were recalled. Most important, debt was slashed. Today, International Textile Group has just about $50 million in debt, less than the two companies were paying in interest a few years ago.

In the Charlie Rose interview Ross discusses his analysis of LTV, which is basically a classic Graham net current asset value analysis:

Ross: We’re in the business not so much of being contrarians deliberately, but rather we like to take perceived risk instead of actual risk. And what I mean by that is that you get paid for taking a risk that people think is risky, you particularly don’t get paid for taking actual risk. So what we had done we analysed the bid we made, we paid the money partly for fixed assets, we basically spent $90 million for assets on which LTV had spent $2.5 billion in the prior 5 years, and our assessment of the values was that if worst came to worst we could knock it down and sell it to the Chinese. Then we also bought accounts receivable and inventory for 50c on the dollar. So between those combination of things, we frankly felt we had no risk.

Charlie Rose: And then next year you bought Bethlehem.

Ross: Yes, but before that even, what happened, out came BusinessWeek asking, “Is Wilbur Ross crazy?”

The joke was, right when everybody was saying, “This is too risky. It’ll never work,” the big debate in our shop was, “Should we just liquidate it and take the profit or should we try to start it up?” That’s how sure we were that we weren’t actually taking a risk, but I wanted to start it up because if you liquidate it you make some money, but you wouldn’t change the whole industry and you wouldn’t make a large sum as we turned out to do.

Watch the interview.

Read Full Post »

Recently I’ve been discussing Michael Mauboussin’s December 2007 Mauboussin on Strategy, “Death, Taxes, and Reversion to the Mean; ROIC Patterns: Luck, Persistence, and What to Do About It,” (.pdf) about Mauboussin’s research on the tendency of return on invested capital (ROIC) to revert to the mean (See Part 1 and Part 2).

Mauboussin’s report has significant implications for modelling in general, and also several insights that are particularly useful to Graham net net investors. These implications are as follows:

  • Models are often too optimistic and don’t take into account the “large and robust reference class” about ROIC performance. Mauboussin says:

We know a small subset of companies generate persistently attractive ROICs—levels that cannot be attributed solely to chance—but we are not clear about the underlying causal factors. Our sense is most models assume financial performance that is unduly favorable given the forces of chance and competition.

  • Models often contain errors due to “hidden assumptions.” Mauboussin has identified errors in two distinct areas:

First, analysts frequently project growth, driven by sales and operating profit margins, independent of the investment needs necessary to support that growth. As a result, both incremental and aggregate ROICs are too high. A simple way to check for this error is to add an ROIC line to the model. An appreciation of the degree of serial correlations in ROICs provides perspective on how much ROICs are likely to improve or deteriorate.

The second error is with the continuing, or terminal, value in a discounted cash flow (DCF) model. The continuing value component of a DCF captures the firm’s value for the time beyond the explicit forecast period. Common estimates for continuing value include multiples (often of earnings before interest, taxes, depreciation, and amortization—EBITDA) and growth in perpetuity. In both cases, unpacking the underlying assumptions shows impossibly high future ROICs. 23

  • Models often underestimate the difficulty in sustaining high growth and returns. Few companies sustain rapid growth rates, and predicting which companies will succeed in doing so is very challenging:

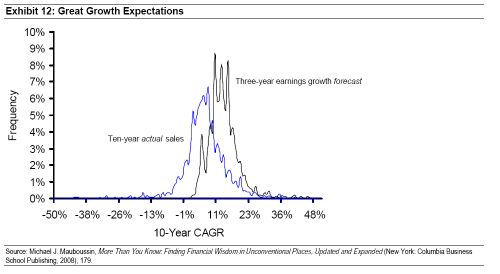
Exhibit 12 illustrates this point. The distribution on the left is the actual 10-year sales growth rate for a large sample of companies with base year revenues of $500 million, which has a mean of about six percent. The distribution on the right is the three-year earnings forecast, which has a 13 percent mean and no negative growth rates. While earnings growth does tend to exceed sales growth by a modest amount over time, these expected growth rates are vastly higher than what is likely to appear. Further, as we saw earlier, there is greater persistence in sales growth rates than in earnings growth rates.

  • Models should be constructed “probabilistically.”

One powerful benefit to the outside view is guidance on how to think about probabilities. The data in Exhibit 5 offer an excellent starting point by showing where companies in each of the ROIC quintiles end up. At the extremes, for instance, we can see it is rare for really bad companies to become really good, or for great companies to plunge to the depths, over a decade.

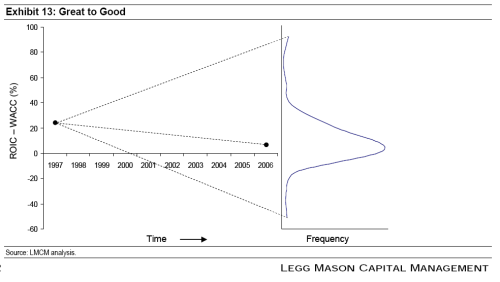
For me, the following Exhibit is the most important chart of the entire paper. It’s Mauboussin’s visualization of the probabilities. He writes:

Assume you randomly draw a company from the highest ROIC quintile in 1997, where the median ROIC less cost of capital spread is in excess of 20 percent. Where will that company end up in a decade? Exhibit 13 shows the picture: while a handful of companies earn higher economic profit spreads in the future, the center of the distribution shifts closer to zero spreads, with a small group slipping to negative.

  • Crucial for net net investors is the need to understand the chances of a turnaround. Mauboussin says the chances are extremely low:

Investors often perceive companies generating subpar ROICs as attractive because of the prospects for unpriced improvements. The challenge to this strategy comes on two fronts. First, research shows low-performing companies get higher premiums than average-performing companies, suggesting the market anticipates change for the better. 24 Second, companies don’t often sustain recoveries.

Defining a sustained recovery as three years of above-cost-of-capital returns following two years of below-cost returns, Credit Suisse research found that only about 30 percent of the sample population was able to engineer a recovery. Roughly one-quarter of the companies produced a non-sustained recovery, and the balance—just under half of the population—either saw no turnaround or disappeared. Exhibit 14 shows these results for nearly 1,200 companies in the technology and retail sectors.


Mauboussin concludes with the important point that the objective of active investors is to “find mispriced securities or situations where the expectations implied by the stock price don’t accurately reflect the fundamental outlook:”

A company with great fundamental performance may earn a market rate of return if the stock price already reflects the fundamentals. You don’t get paid for picking winners; you get paid for unearthing mispricings. Failure to distinguish between fundamentals and expectations is common in the investment business.

Read Full Post »

I’m a huge fan of James Montier’s work on the rationale for a quantitative investment strategy and global Graham net net investing. Miguel Barbosa of Simoleon Sense has a wonderful interview with Montier, covering his views on behavioral investing and value investment. Particularly interesting is Montier’s concept of “seductive details” and the implications for investors:

Miguel: Let’s talk about the concept of seductive details…can you give us an example of how investors are trapped by irrelevant information?

James Montier: The sheer amount of irrelevant information faced by investors is truly staggering. Today we find ourselves captives of the information age, anything you could possibly need to know seems to appear at the touch of keypad. However, rarely, if ever, do we stop and ask ourselves exactly what we need to know in order to make a good decision.

Seductive details are the kind of information that seems important, but really isn’t. Let me give you an example. Today investors are surrounded by analysts who are experts in their fields. I once worked with an IT analyst who could take a PC apart in front of you, and tell you what every little bit did, fascinating stuff to be sure, but did it help make better investment decisions, clearly not. Did the analyst know anything at all about valuing a company or a stock, I’m afraid not. Yet he was immensely popular because he provided seductive details.

Montier’s “seductive details” is reminiscent of the discussion in Nicholas Taleb’s Fooled by Randomness on the relationship between the amount of information available to experts, the accuracy of judgments they make based on this information, and the experts’ confidence in the accuracy of these judgements. Intuition suggests that having more information should increase the accuracy of predictions about uncertain outcomes. In reality, more information decreases the accuracy of predictions while simultaneously increasing the confidence that the prediction is correct. One such example is given in the paper The illusion of knowledge: When more information reduces accuracy and increases confidence (.pdf) by Crystal C. Hall, Lynn Ariss, and Alexander Todorov. In that study, participants were asked to predict basketball games sampled from a National Basketball Association season:

All participants were provided with statistics (win record, halftime score), while half were additionally given the team names. Knowledge of names increased the confidence of basketball fans consistent with their belief that this knowledge improved their predictions. Contrary to this belief, it decreased the participants’ accuracy by reducing their reliance on statistical cues. One of the factors contributing to this underweighting of statistical cues was a bias to bet on more familiar teams against the statistical odds. Finally, in a real betting experiment, fans earned less money if they knew the team names while persisting in their belief that this knowledge improved their predictions.

This is not an isolated example. In Effects of amount of information on judgment accuracy and confidence, by Claire I. Tsai, Joshua Klayman, and Reid Hastie, the authors examined two other studies that further that demonstrate when decision makers receive more information, their confidence increases more than their accuracy, producing “substantial confidence–accuracy discrepancies.” The CIA have also examined the phenomenon. In Chapter 5 of Psychology of Intelligence Analysis, Do you really need more information?, the author argues against “the often-implicit assumption that lack of information is the principal obstacle to accurate intelligence judgments:”

Once an experienced analyst has the minimum information necessary to make an informed judgment, obtaining additional information generally does not improve the accuracy of his or her estimates. Additional information does, however, lead the analyst to become more confident in the judgment, to the point of overconfidence.

Experienced analysts have an imperfect understanding of what information they actually use in making judgments. They are unaware of the extent to which their judgments are determined by a few dominant factors, rather than by the systematic integration of all available information. Analysts actually use much less of the available information than they think they do.

Click here to see the Simoleon Sense interview.

Read Full Post »

Yesterday I ran a post on Dr. Michael Burry, the value investor who was one of the first, if not the first, to figure out how to short sub-prime mortgage bonds in his fund, Scion Capital. In The Big Short, Michael Lewis discusses Burry’s entry into value investing:

Late one night in November 1996, while on a cardiology rotation at Saint Thomas Hospital, in Nashville, Tennessee, he logged on to a hospital computer and went to a message board called techstocks.com. There he created a thread called “value investing.” Having read everything there was to read about investing, he decided to learn a bit more about “investing in the real world.” A mania for Internet stocks gripped the market. A site for the Silicon Valley investor, circa 1996, was not a natural home for a sober-minded value investor. Still, many came, all with opinions. A few people grumbled about the very idea of a doctor having anything useful to say about investments, but over time he came to dominate the discussion. Dr. Mike Burry—as he always signed himself—sensed that other people on the thread were taking his advice and making money with it.

Michael Burry’s blog, http://www.valuestocks.net, seems to be lost to the sands of time, but Burry’s techstocks.com “Value Investing” thread (now Silicon Investor) still exists. The original post in the thread hints at the content to come:

Started: 11/16/1996 11:01:00 PM

Ok, how about a value investing thread?

What we are looking for are value plays. Obscene value plays. In the Graham tradition.

This week’s Barron’s lists a tech stock named Premenos, which trades at 9 and has 5 1/2 bucks in cash. The business is valued at 3 1/2, and it has a lot of potential. Interesting.

We want to stay away from the obscenely high PE’s and look at net working capital models, etc. Schooling in the art of fundamental analysis is also appropriate here.

Good luck to all. Hope this thread survives.

Mike

Hat tip Toby.

Read Full Post »

The superb Manual of Ideas blog has an article by Ravi Nagarajan, Marty Whitman Reflects on Value Investing and Net-Nets, on legendary value investor Marty Whitman’s conversation with Columbia Professor Bruce Greenwald at the Columbia Investment Management Conference in New York. I have in the past discussed Marty Whitman’s adjustments to Graham’s net net formula, which I find endlessly useful. Whitman has some additional insights that I believe are particularly useful to net net investors:

“Cheap is Not Sufficient”

At several points in the discussion with Prof. Greenwald, Mr. Whitman came back to a central theme:  It is not sufficient for a security to be “cheap”.  It must also possess a margin of safety as demonstrated by a strong balance sheet and overall credit worthiness.   In other words, there are many securities that may appear cheap statistically based on a number of common criteria investors use to judge “cheapness”.  This might include current year earnings compared to the stock price, current year cash flow, and many others.  However, if the business does not have a durable balance sheet, adverse situations that are either of the company’s own making or due to macroeconomic factors can determine the ultimate fate of the company.  A durable balance sheet demonstrates the credit worthiness a business needs to manage through periodic adversity.

Whitman also discusses an issue near and dear to my heart: good corporate governance, and, by implication, activism:

One other point that Mr. Whitman made while discussing corporate governance also applies to many net-net situations.  The true value of a company may never come out if there is no threat of a change in control.  This obviously makes intuitive sense because the presence of a very cheap company alone will not result in realization of value unless management is willing to act in the interests of shareholders either by liquidating a business that has no future prospects but a very liquid balance sheet or taking steps to improve the business.

Read the balance of the article at The Manual of Ideas blog.

Read Full Post »

Older Posts »