Feeds:
Posts
Comments

Archive for May, 2014

Greenbackd and Eyquem Investment Management are proud supporters of the Capitalize for Kids Investors Conference.

Capitalize for Kids brings the investment community together at an annual event centered around great investment ideas and in doing so, provides support for the Hospital for Sick Children. Sophisticated investors will converge to meet, share ideas, and learn from some of the world’s most successful money managers, many of whom rarely share their ideas publicly.

This year’s speakers include Larry Robbins, founder of Glenview Capital Management; Jamie Dinan, founder and CEO of York Capital Management; Jacob Doft, Jeffrey Smith CEO and CIO at Starboard Value; Sahm Adrangi Managing Partner, Kerrisdale Capital Management; Steven Shapiro, founding partner of GoldenTree; and more than a dozen other world class institutional investors ready to share actionable ideas with attendees and detail their approach to analyzing potential investments.

Where:

Arcadian Court
401 Bay Street, Simpson Tower, 8th Floor
Toronto, ON M5H 2Y4

When:

October 23 – 24th, 2014

Fees:

Single Seat: $2,500
Table of 10 Seats: $25,000

Contact Information:

Register Today for Capitalize for Kids Investors Conference

Our Speakers 

  • Lee Ainslie III of Maverick Capital
  • Steve Shapiro of GoldenTree Asset Management
  • Marc Lasry of Avenue Capital
  • Larry Robbins of Glenview Capital Management
  • Jody LaNasa of Serengeti Asset Management
  • Jamie Dinan of York Capital
  • Jacob Doft of Highline Capital Management
  • Michael Thompson of BHR Capital
  • Brian Zied of Charter Bridge Capital
  • Jeffrey Smith of Starboard Value
  • Evan Vanderveer of Vanshap Capital
  • Frank Brosens of Taconic Capital
  • Jeff Hales of Alignvest Capital
  • Scott Ferguson of Sachem Head Capital Management
  • Chuck Akre of Akre Capital
  • Guy Gottfried of Rational Capital
  • Sahm Adrangi of Kerrisdale Capital
  • John Thiessen of Vertex One

What Are We Supporting?

We are committed to raising funds in support of the highest priority needs of the Centre for Brain and Mental Health. An investment in one of the key funding priorities listed below will help ensure that SickKids remains at the forefront of brain health research, learning, and care for the benefit of children everywhere:

  • Seed Funding Grant Competition
  • Integrative Fellowships
  • Knowledge Translation Program
  • Neonatal Intensive Care Unit (NICU) MRI Scanner
  • Epilepsy Classroom

Register for Capitalize for Kids Investors Conference

capitalize-for-kids-investors-conference-page-001

Advertisement

Read Full Post »

The humble price-to-earnings (PE) ratio is a remarkably well-performed fundamental ratio. While I generally favor the enterprise multiple when demonstrating the utility of focusing on intrinsic value and investing in undervalued stocks (for the reasons outlined here), I’d be very happy to run a portfolio if I was only able to use the PE ratio.

Set out below are the results of two Fama and French backtests of earnings yield (the inverse of the PE ratio) data from 1951 to 2013. As at December 2013, there were 2,406 firms in the sample. The value decile contained the 283 stocks with the highest earnings yield, and the glamour decile contained the 281 stocks with the lowest earnings yield. The average size of the glamour stocks is $4.4 billion and the value stocks $4.3 billion. (Note that the average is heavily skewed up by the biggest companies. For context, the 2,406th company has a market capitalization today of $300 million, which is much smaller than the average, but still investable for most investors). Stocks with negative earnings were excluded. Portfolios are formed on June 30 and rebalanced annually.

Annual and Compound Returns (Portfolio Constituents Weighted by Market Capitalization)

In this backtest, the two portfolios weighted by market capitalization, which means that bigger firms contribute more to the performance of the portfolio, and smaller firms contribute less. Here we can see that the value decile has comprehensively outperformed the glamour decile, returning 16.7 percent compound (19 percent in the average year) over the full period versus 9.3 percent for the glamour decile (11.6 percent in the average year).

PE VW Returns 1951 to 2013

Average Earnings Yield (Market Capitalization Weight)

The reason for value’s outperformance is not very complicated. The value portfolios simply generated more earnings per dollar invested (19.1 percent versus 2.8 percent for the glamour portfolio):

Earnings Yield VW 1951 to 2013

Recent Performance (Market Capitalization Weight)

This is not a historical aberration. If we examine just the period since 1999, we find that, though the return is lower than the long term average, value continued to be the better bet.

VW PE Returns 1999 to 2013

Value has massively outperformed glamour since 1999, beating it by more than 10 percent compound, and 5.5 percent in the average year. The reason for lower returns recently may be due to the ubiquity of value strategies, but more likely it’s because the market is still working off the massive overvaluation in the late 1990s Dot Com boom.

Market capitalization-weighted returns are useful for demonstrating that the outperformance of value over glamour is not a function of the value portfolios containing smaller stocks. For most investors, market capitalization-weighted returns are irrelevant because we’re not going to invest portfolio capital according to a stock’s market cap. For one thing, it’s more difficult to manage and calculate on the fly than an equal weight portfolio, and it leads to lower returns. More likely, we’re either going to equal weight the portfolio (simply equally dividing the total portfolio capital over the total number of positions, say 10 to 30 stocks) or Kelly weight our best ideas. The equal weight returns are therefore more useful for most investors. For equal weight portfolios, the smallest stock is the most important one because the smallest stock constrains the portfolio capital, setting the maximum capital that can be invested in every other stock in the portfolio. (Recall that the smallest company in the sample has a market capitalization today of $300 million, which is investable for most investors.)

Annual and Compound Returns (Portfolio Constituents Equally Weighted)

PE EW Returns 1951 to 2013

In the equal weight backtest value generated 20.1 percent compound (23.3 percent on average), beating out glamour’s 9.8 percent compound return (13.3 percent on average).

Average Earnings Yield (Equal Weight)

Earnings Yield EW 1951 to 2013

Again, the value portfolios simply out-earned the glamour portfolios, generating 17.2 percent on average versus 2.7 percent in the glamour portfolios. It’s interesting to note that the average earnings yield for the equally weighed value portfolio is slightly lower than the average earnings yield for the market capitalization-weighted portfolios, which indicates that, over the full period, bigger stocks tended to be a cheaper method for buying earnings than smaller stocks. That won’t always be the case, but it’s interesting nonetheless.

Recent Performance (Equal Weight)

EW PE Returns 1999 to 2013

In the equal weight portfolios, value also outperformed glamour since 1999, beating it by 8.3 percent compound, and 7.1 percent in the average year.

Over the long run, cheap stocks tend to outperform more expensive stocks, and the PE ratio is useful metric for sorting cheap stocks from expensive stocks.

My firm, Eyquem, has just started offering low cost, fee-only managed accounts that implement a systematic deep value investment strategy. Please contact me by email at toby@eyquem.net or call me by telephone on (646) 535 8629 to learn more.

Click here if you’d like to read more on Quantitative Value, or connect with me on LinkedIn.

Read Full Post »

Many value investors regard the period since the beginning of 2008 as a difficult one for value strategies. After the bonanza for value in the early 2000s, when a number of value guys made their name, the going has been much tougher in the latter part of the 2000s, and early 2010s. One theory for the lower performance of value–the one to which I subscribe–is that value stocks were much cheaper in the early 2000s than they have been since because the dot com boom was mostly restricted to big, “new economy” stocks. Smaller “old economy” stocks were neglected, and unusually good value. (For more on this, see for example, this post: Implications of All-Time-High Median Valuations).

Another theory is that value strategies are now so well known and easy to implement that undervalued stocks are completely picked over, and the only cheap stocks left are value traps. Call this the “Magic Formula” effect, named for Joel Greenblatt’s cheap but good strategy discussed in his Little Book That Beats The Market, which was published in 2006. The argument goes something like, “The Little Book and the free website have made it so easy to find good, cheap stocks that there’s nothing left.” (I have a few thoughts on how to beat The Little Book That Beats The Market).

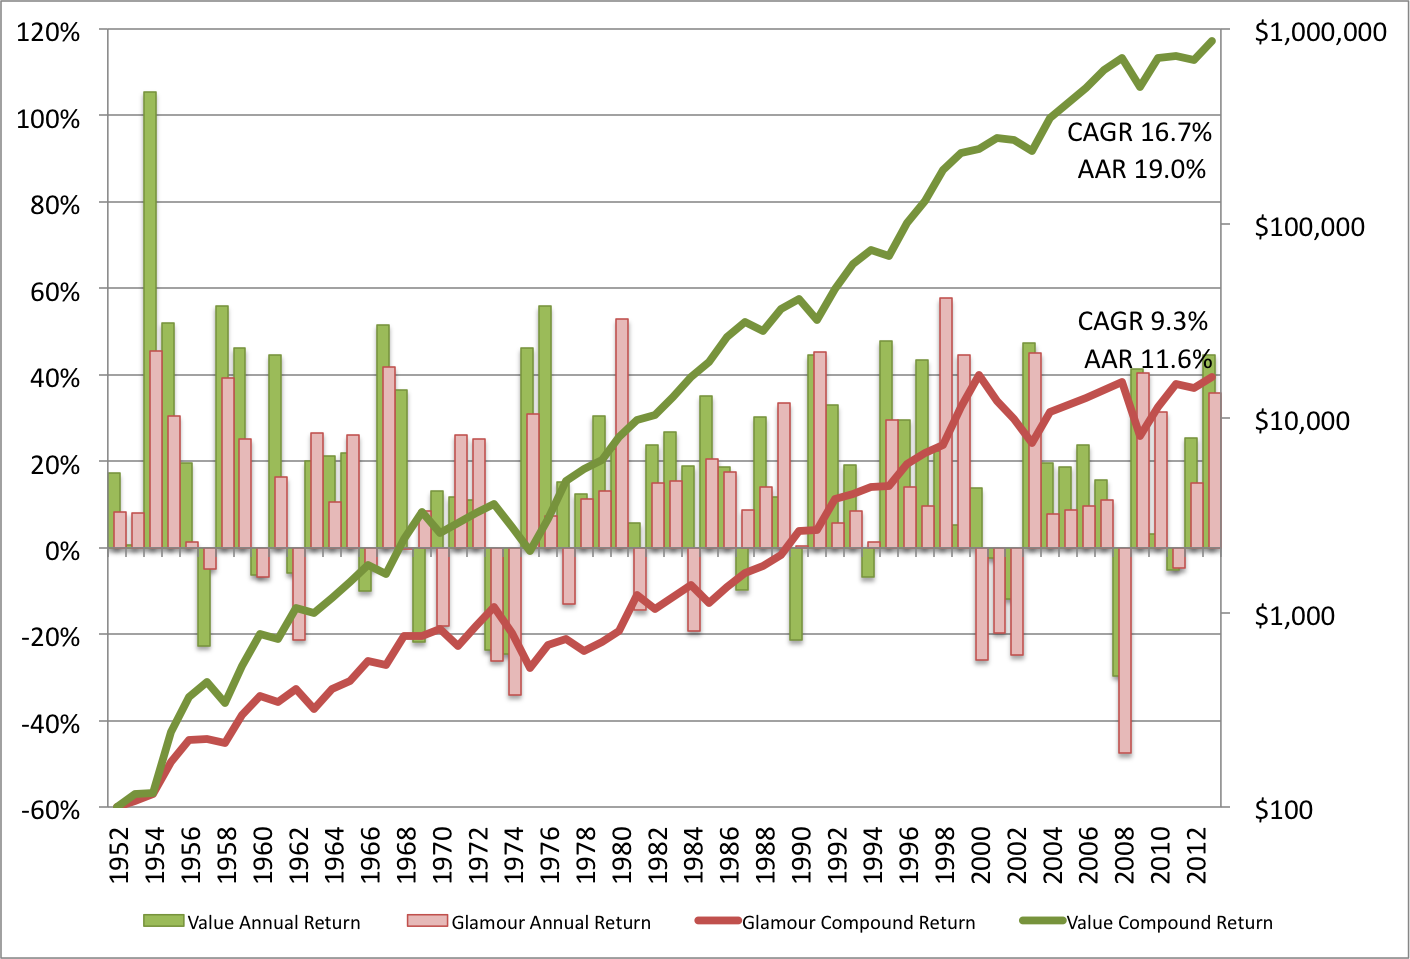
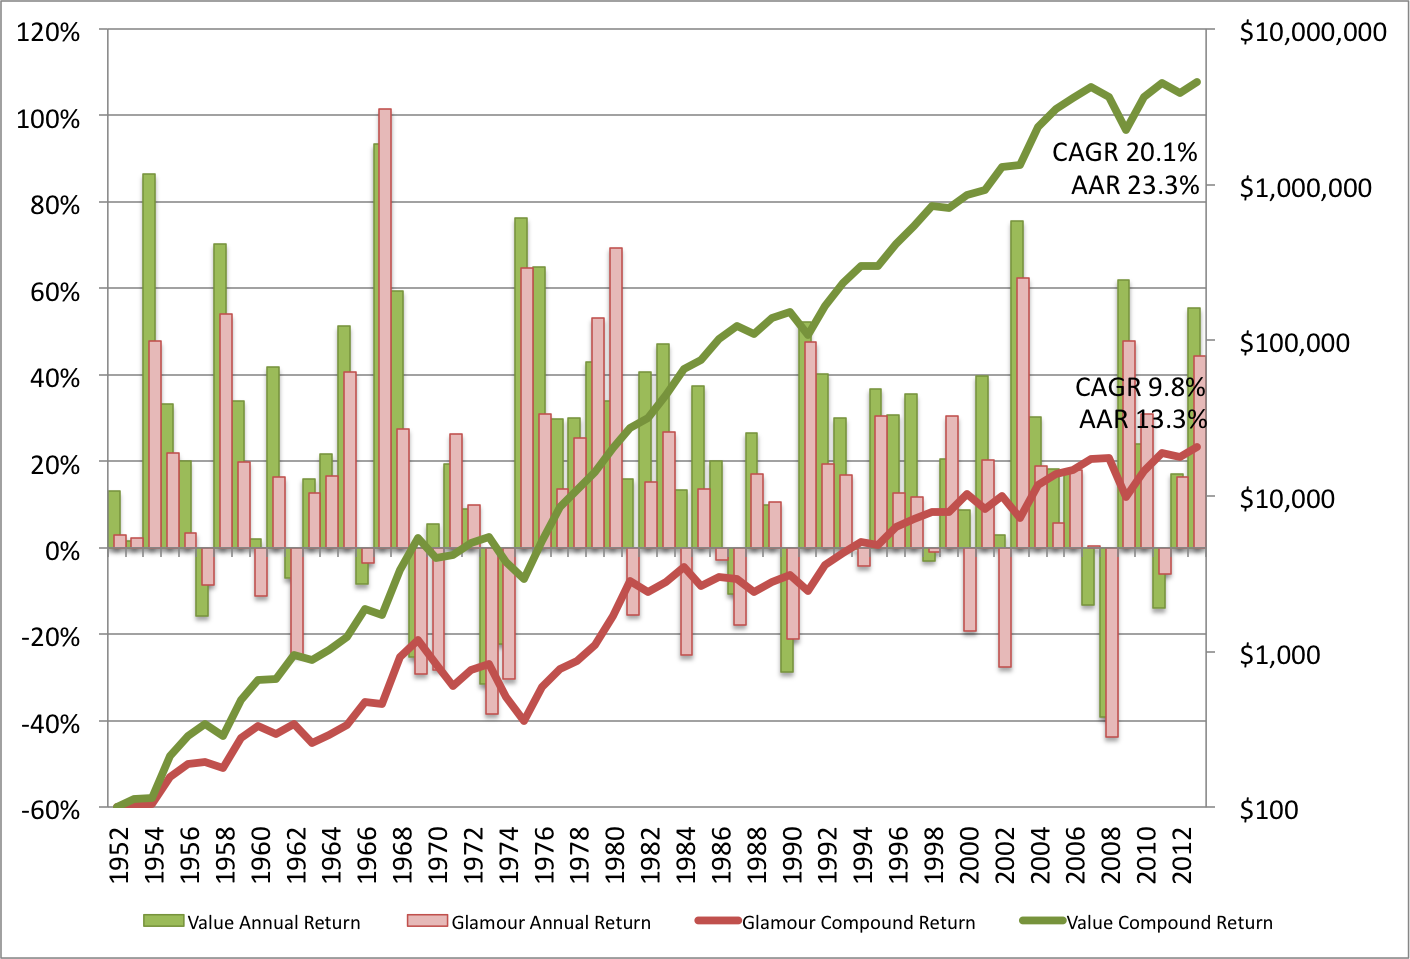
To see how tough it has been for value investors, and the impact of the Magic Formula effect, I backtested the performance of four indexes against the value decile of each (measured by the enterprise multiple or EBITDA / enterprise value —overview of the research on the enterprise multiple here). The universes I tested were the S&P 500, the Russell 1000, the Russell 3000 and the Russell 2000. As always, I lagged the fundamental data by 6 months (so portfolios formed 1/1 in year t use data from 6/30 in year t-1). All portfolios are equally weighted (for example, the 300 stocks in the Russell 3000 value decile hold 0.333 percent of the theoretical portfolio capital at inception and the ~3,000 stocks in the Russell 3000 portfolio hold 0.0333 percent of portfolio capital at inception). In the chart below, the value deciles are a hue of green, and the indexes are all reds.

Value versus Market 2008 to May 2014

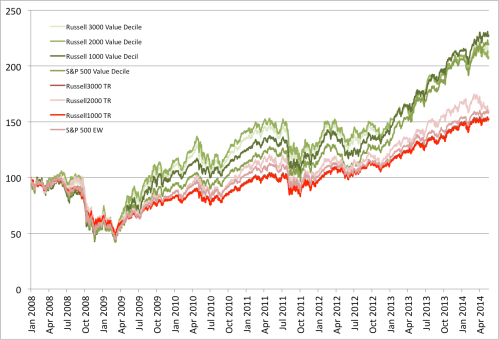
EBITDA/EV Value Deciles versus Indexes (2008 to Present)


The chart shows that all the value deciles have comprehensively outperformed each of the indexes over the full period since 2008. It’s not even close. And a great deal of the outperformance seems to be recent. Here are the statistics for each index and the corresponding value decile.

S&P 500

S&P 500 Stats Value and Markets 2008 to Present

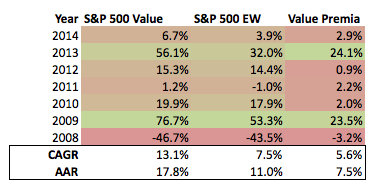
The S&P 500 is the largest, most liquid index, containing the largest ~500 stocks in the market. The smallest company has a market capitalization greater than $3 billion. It is heavily picked over. If ever there was an index that should suffer from the Magic Formula effect, this is it. Here we find that the value decile generate 17.8 percent per year compound, outperforming the index by 5.6 percent per year compound over the full period (and by 7.5 percent on average). $100,000 invested in the value decile in 2008 is worth $219,610 today, versus $158,440 for the S&P 500. The value decile also beat the S&P 500 in 6 out of 7 years, slightly underperforming in 2008. Value still works in S&P 500.

Russell 1000

Russell 1000 Stats Value and Markets 2008 to Present

The Russell 1000 contains the largest 1000 stocks in the market. The value decile returned 19.8 percent compound over the full period, beating its corresponding index by 7.0 percent per year compound (and by 10.7 percent on average). $100,000 invested in the value decile in 2008 is worth $227,280 today, versus $151,920 for the Russell 1000. Though the value decile outperformed by a wide margin over the full period, the value decile only beat the Russell 1000 in 4 out of 7 years. When it did outperform, however, it did so by a lot: 60.2 percent in 2009 and almost 20 percent in 2013.
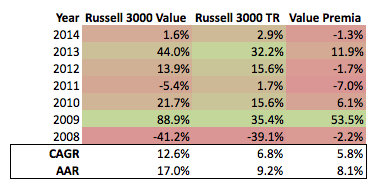
Russell 3000

Russell 3000 Stats Value and Markets 2008 to Present

The value decile of the Russell 3000–the largest 3000 stocks in the market, and the broadest investable universe–returned 17 percent compound over the full period, beating out its index by 5.8 percent per year compound (and by 8.1 percent in the average year). $100,000 invested in the value decile in 2008 is worth $213,190 today, versus $152,540 for the Russell 3000. Here we find something interesting. Though the value decile outperformed over the full period, it only outperformed the market in 3 out of 7 years, which means that the value decile underperformed the Russell 3000 more than half the time. Perhaps this is the Magic Formula effect in action. Still, you were better off in the value decile by a wide margin over the full period. (Even if you started in 2010, and missed the big year of outperformance in 2009, you were still ahead of the Russell 3000 by 16.2 percent compound versus 14.9 percent for the index to today.)

Russell 2000

Russell 2000 Stats Value and Markets 2008 to Present
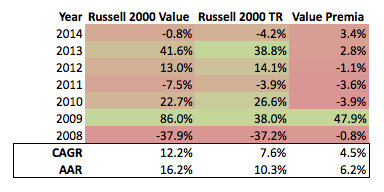
The Russell 2000 is the smallest 2000 stocks in the Russell 3000 (the same universe as the Russell 3000 excluding the largest 1000 stocks). The value decile generated 16.2 percent compound over the full period, beating the Russell 2000 by 4.5 percent per year (or 6.2 percent in the average year). $100,000 invested in the value decile in 2008 is worth $207,930 today, versus $159,990 for the Russell 2000. Again, though the value decile outperformed by a wide margin over the full period, it only beat the Russell 2000 index in 3 out of 7 years, less than half the time.

Value investors are right. The period since 2008 has been more difficult for value strategies than it was in the early 2000s. But simple value strategies have still outperformed over the full period, and by a wide margin. This is despite the fact that, in many instances, the value decile often underperforms the market, and in some cases, more than half the time. If that’s the impact of the Magic Formula effect, I’ll take it.

My firm, Eyquem, has begun offering low cost, fee-only managed accounts that implement a deep value investment strategy. Please contact me by email at toby@eyquem.net or by telephone on (646) 535 8629 to learn more.

Click here if you’d like to read more on Quantitative Value, or connect with me on LinkedIn.


Read Full Post »

Greenbackd is able to offer  a special discount – over 50% off! — on registrations for the NY Congress taking place September 8 & 9, 2014.

This year, seating will be strictly limited to 275, so we encourage Greenbackd readers to register now, before the Congress sells out.

Regular Price: $5,995

Special Offer – Over 50% off (Offer expires: June 24, 2014)

To access the special offer, go to Valueinvestingcongress.com/congress/register-now-partners/ and use discount code: GREENBACKD

Information about the 10th Annual New York Value Investing Congress

  • Date:  September 8 – 9, 2014

Confirmed speakers include:

  • Leon Cooperman, Omega Advisors
  • Alexander Roepers, Atlantic Investment Management
  • Carson Block, Muddy Waters Research
  • Whitney Tilson, Kase Capital
  • Sahm Adrangi, Kerrisdale Capital Management
  • David Hurwitz, SC Fundamental
  • Jeffrey Smith, Starboard Value
  • Michael Kao, Akanthos Capital Management
  • Guy Gottfried, Rational Investment Group
  • John Lewis, Osmium Partners
  • Tim Eriksen, Eriksen Capital Management
  • Cliff Remily, Northwest Priority Capital
  • With many more to come!


Greenbackd receives consideration for promoting this event.

Read Full Post »

Last week  I looked at the implications of all-time-high valuations on returns in the S&P 500. This week I’ve examined the implications of high valuations on drawdown for stocks in the Russell 1000. I looked at the two most recent crashes–the 2000 to 2002 Dot Com Bust and the 2007 to 2009 Credit Crisis. I backtested the performance of the Russell 1000 Total Return (TR) and its value decile measured using the enterprise multiple (EBITDA / enterprise value — overview of the research on the enterprise multiple here). I lagged the fundamental data by 6 months (so portfolios formed 6/30 in year t use data from 12/31 in year t-1). All portfolios are equally weighted (the 100 stocks in the value decile hold 1 percent of the theoretical portfolio capital at inception and the ~1,000 stocks in the Russell 1000 portfolio hold 0.1 percent of portfolio capital at inception).

Here’s the Dot Com Bust:

Dot Com Bust

Performance of the Russell 1000 TR and Russell 1000 TR Value Decile During the Dot Com Bust (1999 to 2006)

The Dot Com Bust started in the Russell 1000 TR on September 1st, 2000. When it reached its low on October 9, 2002, two years and one month later, it had fallen 48.09 percent. It would not recover its losses from the September 1st, 2000 peak until October 12, 2006, more than six years and one month later.

By contrast, the value decile of the Russell 1000 fared much better. While it initially drew down from September 1st, 2000 more than 22 percent in sympathy with the market, it quickly recovered to make new highs by November that year. It would continue to make new highs until April 17, 2002, at which point it began falling, ending down 36.03 percent on October 9, 2002–the same day the market bottomed. The value decile recovered much faster than the Russell 1000 TR, regaining all its lost ground by September 19, 2003, one year and five months from its prior peak. 

It would not fare so well in the Credit Crisis (shown below):

Credit Crisis Drawdown

Performance of the Russell 1000 TR and the Russell 1000 TR Value Decile During the Credit Crisis (2007 to 2012)

The Credit Crisis actually began in the value decile of the Russell 1000 TR on June 4, 2007. The Russell 1000 itself would not start drawing down until a few months later on October 9, 2007. The value decile would find its low on November 21st, 2008 after falling for two years and four months. From peak to trough, the value decile lost 58.31 percent. It would not fully recover until March 30, 2011, almost three years and ten months from the start of the bust. The Russell 1000 bottomed March 9, 2009, after losing 55.41 percent. It would not make a new peak until March 15, 2012, more than three years after its low, and more than five years and four months its last peak.

The shelter offered by the value decile in the Dot Com Bust was missing in the Credit Crisis. If anything, the Credit Crisis hit the value decile harder than the market. It started drawing down four months before the rest of the Russell 1000, and it fell further–58.31 percent versus the Russell 1000’s 55.41 percent. One reason is the relative valuations of the value deciles in the Dot Com Bust and the Credit Crisis. In the early 2000s, value stocks were unusually cheap, with the median of 100 stocks in the value decile of the Russell 1000 yielding (on an EBITDA/EV basis) 17.5 percent in June 1999, 19.5 percent in June 2000, 16.9 percent in June 2001, and 17.2 percent in June 2002. By contrast, the median stock in the Russell 1000 TR yielded 9.0 percent in June 1999, 10.7 percent in June 2000, 10.4 percent in June 2001, and 9.8 percent in June 2002. In the Credit Crisis, the median stock in the value decile yielded 16.75 percent in June 2007, more expensive than at any time in the early 2000s, while the median stock in the market yielded 9.2 percent. The greater yield in the value decile, and the larger spread between the value decile and the market in the Dot Com Bust manifested in a smaller drawdown and a shorter recovery period for the value decile. The slightly smaller yields, and tighter spread in the Credit Crisis led to a larger drawdown, although the value decile did recover much faster than the market, three years and ten months for the value decile versus five years and four months for the market.

Valuation doesn’t tell the whole story, but it’s an important component in the performance of portfolios during stock market crashes. High market valuations are one of the factors that precipitate crashes. Better value portfolios of stocks  sometimes offer a little more protection than overvalued stocks, as they did in the Dot Com bust, but that is unusual. In the ordinary course, correlations go to 1 and everything sells off at the same rate, as it did in the Credit Crisis. Presently, the median stock in the Russell 1000 TR yields just 9.2 percent, while the median stock in the value decile yields almost 16.8 percent. Both are expensive.

Click here if you’d like to read more on Quantitative Value, or connect with me on LinkedIn.


Read Full Post »

Last week I ran a post about the median stock trading at an all-time high valuation that included this chart from “Millennial Investor” Patrick O’Shaughnessy showing historical EBITDA yields for all stocks in the universe greater than $200 million market capitalization from the period 1971 to date:

Historical EBITDA Yields Millennial v2


I backtested the returns for all three portfolios during the most extreme period in the data (from 1999 to date marked in the red square above). I limited my universe to the stocks in the S&P 500 and lagged the fundamental data by 6 months (so portfolios formed 6/30 in year t use data from 12/31 in year t-1). All portfolios are equally weighted (the 50 stocks in each for the Cheap and Expensive portfolios hold 2 percent of the theoretical portfolio capital at inception and the 500 stocks in the Market portfolio hold 0.2 percent of portfolio capital at inception). Here’s the return chart for the three portfolios:

S&P 500 EBITDA Portfolio Returns

(c) Eyquem Investment Management LLC

Here are the return statistics for each of the three portfolios (the cells are conditionally formatted such that green indicates a low yield or a high return, both “good” things, and red indicates a high yield or a low return (both “bad” things):

Value Statistics S&P 500 Deciles

(c) Eyquem Investment Management LLC

There are a few things to note in the chart above.

  • First, the median stock is the most expensive it has been (in the data) at an EBITDA yield of 8.2 percent (here’s my overview of the research on the enterprise multiple — the inverse of the EBITDA yield). The previous peak was 9.2 percent in 2007, and before that 9.7 percent in 1999. We see something similar in the Cheap portfolio too. It is the much more expensive than average, and is exceeded only by 2007 (15.1 percent), and 2002 (14.7 percent–the all-time high).
  • Second, it’s no accident that the worst returns are associated with the lowest EBITDA yields. If we compare the performance of the portfolios we can see that the Expensive portfolio always has the lowest yields and has consistently underperformed the Market and Cheap portfolios (with the only exception being the last year of the dot com bubble in 1999). The Cheap portfolio always has the highest yields and has consistently outperformed the Market and Expensive portfolios (again, with the only exception being the last year of the dot com bubble in 1999).
  • If we look within portfolios and compare one year to the next, we can see that, though the relationship isn’t perfect, there too low yields produce low returns. (The relationship persists perhaps because it isn’t perfect.) The worst returns don’t necessarily occur in the year of overvaluation, but they follow closely. For example, the worst yearly performances for the Market occurred in 2008 (-31.1 percent), 2007 (-11 percent) and 2001 (-6.6 percent) and 1999 (-1.9 percent), and those dates roughly conform with the lowest yields.
  • Finally, the worst years for the Cheap portfolios were in 2008 (-32.1 percent), 1999 (15.7 percent), 2011 (-8.4 percent), 2002 (-5.4 percent), and 2007 (-5.3 percent), and those dates also roughly conform with the dates that the portfolios held stocks with the lowest yields.

There’s no magic to value investment. Low yields produce low returns. High yields produce high returns. The relationship isn’t perfect. Outlier years like 1999, and 2011 will occur occasionally, but, on average, you’re better served buying Cheap stocks, and remaining cautious during periods when the median stock in the market offers a historically low yield, like right now.

Click here if you’d like to read more on Quantitative Value, or connect with me on LinkedIn.

Read Full Post »

%d bloggers like this: