Feeds:
Posts
Comments

Archive for February, 2014

From the FTAlphaville’s “This is Nuts. When’s the crash?” series:

We argue Tesla cannot be valued on near-term multiple metrics like traditional auto companies given that we expect Tesla to multiply revenues by more than 10x from 2013 to 2016 by nearly 30x by 2020 and around 60x by 2028. We have thus chosen a 15-year time horizon for our DCF which captures the full maturation of the Model S, Model X (and top-hat derivatives) and also the ramp up of its mass market electric vehicle (the Gen 3). We have applied a 11% WACC with a range of 9% to 13%. The terminal value, calculated on a midpoint of 10x EV/EBITDA accounts for roughly 50% of the total DCF value across the range of methodologies we have applied to arrive at our PT.

New base case: a $320 share price, implying an almost $40bn market capitalisation.

New Bull case, $500/share or more than a $60bn valuation.

Tesla sales over the last four quarters: $1.7bn.

Tesla share price over the same period:

Revs 10x in three years. 11% WACC. 10x EBITDA/EV multiple at terminal value. Bull. Market. Insanity.

Click here if you’d like to read more on Quantitative Value, or connect with me on LinkedIn.

Advertisement

Read Full Post »

In 7-Footers In A Sea Of Pygmies: Why Concentrating On Just The Averages Obscures True Market Insights, Lonnie and Jacob from Farnam Street Investments have a great post on the current lack of dispersion in stock valuations. The corollary to last week’s post on the extremely tight distribution of P/E multiples for stocks in the S&P 500 (the tightest in 25 years) is that there are now fewer stocks with low P/Es than at any time in the last 25 years.

While the stock market peak in 2000 was higher than the current market (measured on the basis of the Shiller P/E ratio) the wider distribution of P/Es meant that there were many bargains available in 2000. Jacob and Lonnie write:

When there’s a wide range of cheap and expensive, the thoughtful investor can still find deals, even if the averages are generally high.

This is exactly what we saw in 2000 to 2001. Because of the disruptive arrival of the Internet, many stocks were priced to the moon, while some were being practically given away. The prevailing narrative was that new-economy internet stocks were the wave of the future and old-economy stocks were soon-to-be-extinct dinosaurs. This created a two-tiered market with a record high average price (the Shiller P/E was 44.2 in December 1999!), but a plethora of deals are available at the bottom. The chart below shows that time frame having a record high dispersion; it was a tribe with an incredibly wide range of heights to choose from.

What type of market do we find ourselves in today?

Looking back at our dispersion chart above, we’re currently at a 25-year low, meaning the cheapest 10% of the market looks an awful lot like the other 90%. And if you normalize earnings at all, the current P/E is extremely high with the Shiller CAPE at 25x. Prices are expensive and tightly packed around the average, meaning we shouldn’t expect very good returns from here. In fact by some statistical thresholds that we’ve already crossed, it’s one of the top five most dangerous markets of all time. It will be extremely difficult to be a stock picking hero in this environment. Even though the 2000 market average was higher than today, the 2000 time frame delivered a much better hunting ground.

Jacob and Lonnie conclude:

Value investors are known for ignoring “macro” developments and relying solely on their skills as bottom-up stock pickers. Their depth of research is usually unparalleled, but there’s a general hesitancy in considering broader market valuations in their analysis. We’re value investors through and through, but we think it’s a mistake not to pay attention to what the current investment opportunity set looks like compared to different points in history.

Read Farnam Street Investments’  7-Footers In A Sea Of Pygmies: Why Concentrating On Just The Averages Obscures True Market Insights.

Order Quantitative Value from Wiley FinanceAmazon, or Barnes and Noble.

Click here if you’d like to read more on Quantitative Value, or connect with me on LinkedIn.

Read Full Post »

Great piece from Tocqueville Funds’ François Sicart called Contrarian Investing in a Liquidity-Driven Environment. Tocqueville is a “bottom-up” value investor:

Individual stock selection prevails over macro opinions, be they about the economy or the markets.

This approach generally has been vindicated in the past, as value investors tended to outperform a majority of money managers over full market cycles; and this outperformance has been achieved principally during bear markets, by losing less than most.  The reason, I believe, is so obvious as to sound simplistic:  When a stock is selling close to the “intrinsic” value of its underlying company’s shares, it does not have to travel down very much to find a floor.

Good logic, but it didn’t protect Tocqueville of anyone else in 2007 to 2009:

In spite of this “unquestionable” logic, the great majority of portfolios (including those of some iconic value investors) were engulfed in the panicky downward spiral that followed the Lehman Bros. failure, between the summer of 2008 and the final bottom, in early 2009.

That part of the overall 53-percent decline from the 2007 top to the 2009 bottom was generally indiscriminate – more so than I can remember throughout my career, with the possible exception of the one-day crash of 1987; but that violent but brief market episode did not trigger a global financial crisis or recession.

“But it’s a market of stocks”:

At this stage of a discussion, a broker would typically tell you, “This is not a stock market, but a market of stocks,” implying that there are always attractive investments somewhere, even when the overall market seems overpriced.  And although this is a typical sales pitch, they usually are correct.  This time, however, we may have to work harder to find those attractive investments.

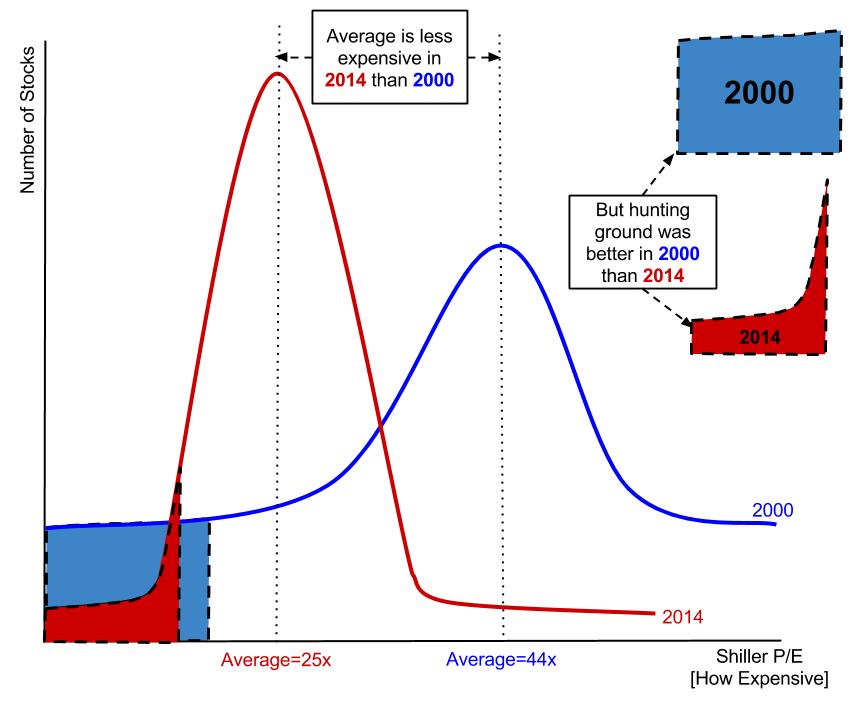
David Kostin, Goldman Sachs’ chief U.S. equity strategist, explained that investor demand for “value” has been so pervasive that low-valuation stocks had outperformed higher valuation peers by 12 percent in 2013.  As a result, the distribution of S&P 500 P/E multiples was now its tightest in at least 25 years, implying less differentiation of companies based on valuation.

“With valuation clustered together, we believe there are attractive relative value opportunities where companies with different fundamentals are trading at very similar valuation levels.”

If you’re having trouble finding undervalued stocks, this is some indication that it’s not just you. The current valuation spread is narrower than it was in 2007, and stands in stark contrast to the early 2000s when it was wider than usual.

Read Tocqueville Funds’ Contrarian Investing in a Liquidity-Driven Environment.

h/t Farnam Street Investments.

Order Quantitative Value from Wiley FinanceAmazon, or Barnes and Noble.

Click here if you’d like to read more on Quantitative Value, or connect with me on LinkedIn.

Read Full Post »

%d bloggers like this: