Feeds:
Posts
Comments

Archive for June, 2014

As we’ve seen over the last few weeks, value has comprehensively outperformed glamour stocks since 1951. Value also outperforms the market. Whether we examine the simple fundamental metrics like the price-to-earnings (PE) ratio, the price-to-book value (PB) ratio, and the price-to-cashflow (PCF) ratio, the dividend yield or a compound model of all excluding the dividend yield, all outperform.

Set out below are the results of Fama and French backtests of the equal weight portfolios of each metric’s value decile using data from June 1951 to December 2013 and the market. As at December 2013, there were 2,406 firms in the sample. Stocks with negative earnings, cashflow, or book value were excluded. Portfolios are formed on June 30 and rebalanced annually.

The “market” here is an equal weight, and total return average of all deciles, and includes stocks with negative earnings, cashflow, or book value.

Value Deciles and Market Compound Returns (June 1951 to December 2013)

Combo EW Mthly Returns 1951 to 2013

Value Deciles and Market Drawdowns (June 1951 to December 2013)

Most of this outperformance is to the upside. When the market turns down, value tends to drawdown along with the market. The following chart shows the drawdowns to each of the value deciles and the market.

Combo EW Drawdowns 1951 to 2013

The chart really shows the enormity of the 2007 to 2009 credit crisis. Outside the 1929 crash, which I’ll examine at a later date, every other drawdown pales beside the credit crisis.

Value Decile Drawdowns Relative to the Market (Portfolio Constituents Equally Weighted) June 1951 to December 2013

This chart shows the performance in a drawdown of each of the value deciles relative to the market. Market drawdowns greater than 10 percent are indicated by the grey bars on the chart. Where the lines for each value metric are below the 0 percent midline, the value metric has drawn down further than the market, and where the lines are above the 0 percent midline, value has outperformed in the drawdown.

Combo EW Relative Drawdowns 1951 to 2013

We can see in the chart that, when the market is in a drawdown, the value deciles tend to drawdown faster, and further, and then recover earlier. We can observe this in the  late 1990s-from 1998 until 2000–when value struggled, and then from the early 2000s when value outperformed. We can also see it in the last big drawdown from 2007 to late 2008 when value fell further than the market, and then recovered faster from early 2009.

In a drawdown, value is below the line about twice as often as it is above the line.

Value has comprehensively outperformed the market over a very long period of time. Most of this outperformance seems to the upside. Despite the received wisdom that value has protected portfolios in a drawdown, it seems that value has fallen along with the market. When it does enter a drawdown, value stocks seem to fall first, and at a faster rate than the market, but they also tend to recover earlier, and faster.

Volatility and drawdowns are part and parcel of investing. To generate the extraordinary returns of the value deciles, it was necessary to remain fully invested in those value stocks through thick and thin. My firm, Eyquem, offers low cost, fee-only managed accounts that implement a systematic deep value investment strategy. Please contact me by email at toby@eyquem.net or call me by telephone on (646) 535 8629 to learn more.

Click here if you’d like to read more on Quantitative Value, or connect with me on LinkedIn.

Read Full Post »

Sponsored Post

We’ve added 3 New Speakers to the 10th Annual New York Value Investing Congress!

  • Guy Spier manages the Aquamarine Fund  in Zurich and made headlines by bidding $650,100 with Mohnish Pabrai for a charity lunch with Warren Buffett. He recently authored  the critically acclaimed The Education of a Value Investor.
  • Andrew Left is Executive Editor of Citron Research. He has the longest published and most highly predictive track record of any market commentator or columnist on the specific topic of fraudulent and over-hyped stocks.
  • Adam Crocker is co-manager of Metropolitan Capital Advisors with CNBC’s Karen Finerman. Metropolitan is a  value-oriented hedge fund founded in 1992.

We are now offering  a special discount – over 50% off! — on registrations for the NY Congress taking place September 8 & 9, 2014.  This year, seating will be strictly limited to 275, so we would encourage Greenbackd readers to register now, before we sell out.

Regular Price: $5,995 Special Offer – Over 50% off untill offer expires: 7/15/14

Discount Code: GREENBACKD

URL:  http://www.valueinvestingcongress.com/congress/register-now-partners/

Below please find information about the event:

10th Annual New York Value Investing Congress

  • Date:  September 8 – 9, 2014

Confirmed speakers include:

  • Leon Cooperman, Omega Advisors
  • Alexander Roepers, Atlantic Investment Management
  • Carson Block, Muddy Waters Research
  • Whitney Tilson, Kase Capital
  • Sahm Adrangi, Kerrisdale Capital Management
  • David Hurwitz, SC Fundamental
  • Jeffrey Smith, Starboard Value
  • Michael Kao, Akanthos Capital Management
  • Guy Gottfried, Rational Investment Group
  • John Lewis, Osmium Partners
  • Tim Eriksen, Eriksen Capital Management
  • Cliff Remily, Northwest Priority Capital
  • With many more to come!

Read Full Post »

The combo value metric is the final frontier in value investment. The dark side of the moon. The manned mission to Mars. Like off-label Spam, most combination models are curious, indelicate compounds of parts unknown. Ovine? Bovine? Porcine? We just don’t know.

To illustrate the benefits of combination, in this post I shine a light on a compound model of known parts–the simple fundamental metrics the subject of backtests on this site over the last four weeks: the price-to-earnings (PE) ratio, the price-to-book value (PB) ratio, the price-to-cashflow (PCF) ratio, and the dividend yield.

Set out below are the results of Fama and French backtests of the equal weight portfolios of each metric’s value decile using data from 1951 to 2013. As at December 2013, there were 2,406 firms in the sample. The value decile contained the 283 stocks with the lowest ratio of price to earnings, cashflow, book value or dividends. Stocks with negative earnings, cashflow, book value or dividends were excluded. Portfolios are formed on June 30 and rebalanced annually.

Value Deciles Annual and Compound Returns (Portfolio Constituents Equally Weighted)

Value EW Returns 1952 to 2013

The PE, PB and PCF ratios deliver comparably excellent returns over the full period examined. The dividend yield meanders around not doing much, and few outstanding years are located therein. Studies have shown that the dividend yield is most most useful in conjunction with other measures of shareholder yield including net buybacks and net debt reduction. Including all of shareholder yield’s components leads to a return comparable to the return of PE, PB or PCF. Absent those measures, the dividend yield is an incomplete metric, and underperforms. For that reason, I have excluded it from the combination.

Composite and Component Value Deciles Annual and Compound Returns (Portfolio Constituents Equally Weighted)

Combo EW Returns 1952 to 2013

The composite, which selects portfolios by equally weighting the PE, PB and PCF ratios, delivers a performance over the full period that beats out PE and PB, and slightly underperforms PCF on a compound basis.The composite ratio generates an average annual return that beats out PCF, and PE, but slightly underperforms PB. This is important to note because it demonstrates the advantage of a composite measure over any single measure–even the best single measure periodically underperformed the composite.

Rolling 10-year CAGRs for Composite and Component Value Deciles

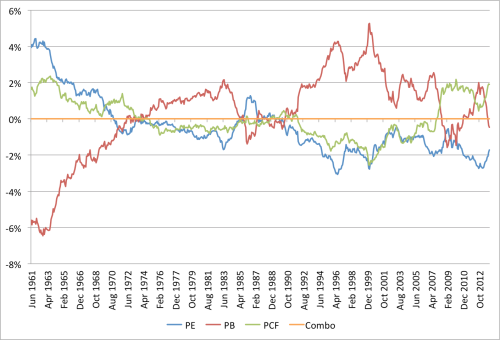
This chart shows the rolling 10-year CAGRs to each of the measures. All are highly correlated, but they diverge materially from time-to-time.


Combo EW Rolling 10yr CAGR 1961 to 2013

The following chart takes the rolling 10-year data from this chart and compares it to the performance of the composite.

Rolling 10-year CAGRs for Components Relative to Composite

Combo EW Relative Rolling 10yr CAGR 1961 to 2013

This chart best illustrates the advantage of using a composite. While the PCF ratio delivered the better return over the full period, it underperformed the combo in 58 percent of rolling 10-year periods. PB was a notable laggard at the beginning of the data, and slightly underperformed over the full period, but the composite was the better bet only 36 percent of the time. PE outperformed strongly at the beginning of the data, but didn’t show thereafter, and so the combo was the better metric 75 percent of rolling ten-year periods.

The attraction of the combo is that it delivers returns comparable to the very best metric at any point in time. While PCF delivered better returns over the full period, most of the outperformance occurred at the beginning of the data, and it lagged thereafter. In contrast, PB underperformed at the start, and then outperformed thereafter. While the combo didn’t ever have its day in the sun as leader, it was the most reliable, never lagging far from the front-runner. Given that we can’t know which metric will be the best at any time, it makes sense to employ all of them if it doesn’t hurt returns too much.

As we’ve seen over the last few weeks, over the long run, and with some regularity, cheap stocks tend to outperform more expensive stocks. The PB, PE and PCF ratios are all very useful metrics for sorting cheap stocks from expensive stocks, but we can’t know which will be the better bet at any given point in time. The combo spreads the risk of underperformance relative to any single metric, and, in doing so, generates reliable investment performance over the full period without lagging far behind the front-runner at point.

My firm, Eyquem, offers low cost, fee-only managed accounts that implement a systematic deep value investment strategy. Please contact me by email at toby@eyquem.net or call me by telephone on (646) 535 8629 to learn more.

Hat tip to Jim O’Shaughnessy whose What Works on Wall Street first discussed the combination metric, and his AAII article “What Works”: Key New Findings on Stock Selection for the idea for the relative performance chart.

Click here if you’d like to read more on Quantitative Value, or connect with me on LinkedIn.

Read Full Post »

The dividend yield is a popular value metric for investors for two reasons. First, it’s the obvious metric for investors favoring income over capital gains. Second, unlike earnings or cashflow, dividends are actually paid out to shareholders, and therefore independently verifiable. Where other metrics like price-to-book value, earnings or cashflow rely on management providing a true accounting of a company’s performance, the dividend is tangible proof of excess free cash flow. Thus, goes the argument, the dividend yield therefore provides the most reliable picture of a company’s business performance, and prospects, which in turn leads to better investment performance.

Set out below are the results of two Fama and French backtests of the dividend yield data from 1926 to 2013. As at December 2013, there were 3,393 firms in the sample. The value decile contained the 198 stocks with the highest earnings yield, and the glamour decile contained the 137 stocks with the lowest earnings yield (the deciles are smaller than 1/10th of the stocks in the sample because fully 1,894 stocks pay no dividend at all). The average size of the glamour stocks is $8.60 billion and the value stocks $3.06 billion. Portfolios are formed on June 30 and rebalanced annually.

Dividend Yield Annual and Compound Returns (Portfolio Constituents Weighted by Market Capitalization)

In this backtest, the two portfolios are weighted by market capitalization, which means that bigger firms contribute more to the performance of the portfolio, and smaller firms contribute less. Here we can see that the value decile has outperformed the glamour decile, returning 10.3 percent compound (13.4 percent in the average year) over the full period versus 8.3 percent for the glamour decile (11.3 percent in the average year).

Dividend Yield VW 1926 to 2013

These returns are considerably lower than the returns found for the price-to-earnings and cashflow ratios over the last few weeks (see Investing Using Price-to-Book Value Ratio or Book Equity-to-Market Equity Multiple (Backtests 1926 to 2013)Investing Using the Price-to-Earnings Ratio and Earnings Yield (Backtests 1951 to 2013) and Investing Using Price-to-Cashflow Ratio and Cashflow Yield (Backtests 1951 to 2013)). The reason is that the earnings and cashflow backtests ran back to only 1951, and the dividend yield data, like the book value return data last week, begins in 1926. The difference is partly due to the 1929 crash, which had an oversized impact on returns. The crash is visible on the chart, and striking–it took almost twenty years for the value decile to fully recover.

To make a comparison possible of dividend yield’s performance to the performance of book, earnings and cashflow over the same period, I also measured the returns beginning in 1951. Since 1951 the high dividend yield value decile has generated a compound annual growth rate (CAGR) of 11.4 percent and an average annual return (AAR) of 13.6 percent. Over the same period the glamour decile returned a CAGR of 9.6 percent and an AAR of 12.9 percent. These returns are still considerably lower than the returns generated by PB, PCF, and PE over the same period.

Dividend Yield Value Premium (Market Capitalization Weight)

The value premium is the outperformance of the value decile over the glamour decile. This chart shows the yearly returns to each of the value and glamour deciles, the value premium (value-glamour) in each year, and the rolling average from the start of the data in 1926:

Dividend Yield VW Value Premium 1926 to 2013

The rolling average tells a sad story for value relative to glamour: The value premium has gradually disappeared over time. Over the 73 years of data to 2000 it was actually zero, but it has slightly recovered since to be 1.8 percent compound over the full period.

Decile Performance (Market Capitalization Weight)

The following chart shows the returns to each of the deciles sorted by dividend yield (Updated to include non-dividend payers).

Dividend Yield and No Div VW Decile CAGR 1926 to 2013

This chart shows that the dividend yield is a fair, but not great, metric for sorting stocks into value and glamour portfolios. This is due to the fact that less than half of all stocks pay dividends (only 44 percent pay dividends). A better comparison might be the dividend payers to the 1,894 stocks in the non-dividend paying cohort. The non-dividend payers (No Div) underperformed all the dividend payers except for the glamour decile, generating a compound annual growth rate (CAGR) of 8.4 percent and average annual return (AAR) of 13.2 percent over the full period (and, since 1951, a CAGR of 9.0 percent and an AAR of 13.5 percent).

Recent Performance (Market Capitalization Weight)

As we’ve seen over the last few weeks, value’s outperformance over glamour is not a historical artifact. If we examine just the period since 1999, we find that value has been the better bet.

Div Yield VW Returns 1999 to 2013

Though it started out almost 40 percent behind in 1999, value outperformed glamour over the period since 1999, beating it by 5.2 percent compound, and 6.5 percent in the average year–about the same differential for PB last week.

Market capitalization-weighted returns are useful for demonstrating that the outperformance of value over glamour is not due to the value portfolios containing smaller stocks. Unless you’re running an index (or hugging an index), they’re not really meaningful. The easiest portfolio weighting scheme is to simply equally weight each position. (If we’re prepared to put up with a little extra volatility for a little extra return, we can also Kelly weight our best ideas). Here are the equal weight return statistics for dividend yield.

Dividend Yield Annual and Compound Returns (Portfolio Constituents Equally Weighted)
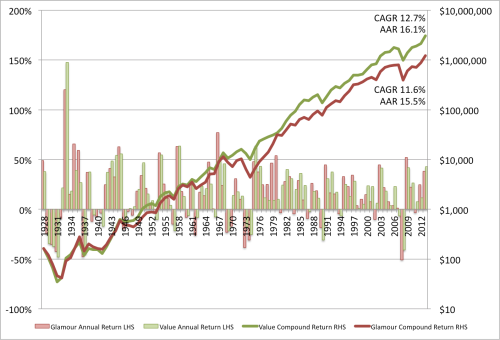
Dividend Yield EW 1926 to 2013

In the equal weight backtest value generated 12.7 percent compound (16.1 percent on average), beating out glamour’s 11.6 percent compound return (15.5 percent on average).

Since 1951 the equally weighted high dividend yield value decile has generated a compound annual growth rate (CAGR) of 13.5 percent and an average annual return (AAR) of 15.7 percent. Over the same period the glamour decile returned a CAGR of 12.5 percent and an AAR of 15.5 percent. These returns are still slightly lower than the returns generated by PB, PCF and PE over the same period.

Dividend Yield Value Premium (Equal Weight)

Dividend Yield EW Value Premium 1926 to 2013

Again, the value premium was never very large for the equal weight portfolios, and has gradually diminished to 1.1 percent compound over the full period.

Decile Performance (Equal Weight)

Dividend Yield and No Div EW Decile CAGR 1926 to 2013

In the equally weighted portfolios, dividend yield does an even poorer job sorting glamour and value portfolios. The dividend payers don’t even reliably outperform the non-dividend paying cohort. The No Div decile, which returned a CAGR of 13.4 percent and an AAR of 21.2 percent over the full period (and, since 1951, a CAGR of 12.4 percent and an AAR or 18.3 percent), beat out the return on the value decile.

Recent Performance (Equal Weight)

Div Yield EW Returns 1999 to 2013

In the equal weight portfolios, value has slightly outperformed glamour since 1999, beating it by a 3.9 percent compound, and 2.8 percent in the average year.

As we’ve seen over the last few weeks, over the long run, and with some regularity, cheap stocks tend to outperform more expensive stocks. Unlike the PB, PE and PCF ratios, which are all very useful metrics for sorting cheap stocks from expensive stocks, the dividend yield is less useful. This is likely because only around 44 percent of all stocks pay dividends. The message seems to be that even expensive dividend paying stocks outperform all non-dividend payers in the market capitalization weighted portfolios, but not in the equal weighted portfolios. Dividend yield doesn’t seem to be a particularly reliable metric for sorting value and glamour.

My firm, Eyquem, offers low cost, fee-only managed accounts that implement a systematic deep value investment strategy. Please contact me by email at toby@eyquem.net or call me by telephone on (646) 535 8629 to learn more.

Click here if you’d like to read more on Quantitative Value, or connect with me on LinkedIn.

Read Full Post »

The price-to-book value ratio (PB) is the granddaddy of the value metrics. Book value is preferred by many value investors to cashflow and earnings metrics because it is stable year-to-year where cashflow and earnings are variable. This is an important property for the following reason: Where a business at a cyclical trough with diminished cashflow and earnings might look expensive on the basis of price-to-cashflow or price-to-earnings, that same business may appear cheap on the basis of price-to-book value because book value won’t fall much or at all in a downturn, and vice versa. Thus, goes the argument, price-to-book value gives a more reliable picture of a company’s usual business performance, which in turn leads to better investment performance.

Set out below are the results of two Fama and French backtests of the book value-to-market equity (the inverse of the PB ratio) data from 1926 to 2013. As at December 2013, there were 3,175 firms in the sample. The value decile contained the 459 stocks with the highest earnings yield, and the glamour decile contained the 404 stocks with the lowest earnings yield. The average size of the glamour stocks is $7.48 billion and the value stocks $2.54 billion. (Note that the average is heavily skewed up by the biggest companies. For context, the 3,175th company has a market capitalization today of $404 million, which is smaller than the average, but still investable for most investors). Portfolios are formed on June 30 and rebalanced annually.

Annual and Compound Returns (Portfolio Constituents Weighted by Market Capitalization)

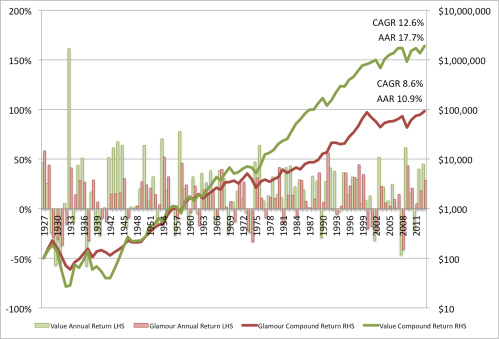
In this backtest, the two portfolios are weighted by market capitalization, which means that bigger firms contribute more to the performance of the portfolio, and smaller firms contribute less. Here we can see that the value decile has comprehensively outperformed the glamour decile, returning 12.6 percent compound (17.7 percent in the average year) over the full period versus 8.6 percent for the glamour decile (10.9 percent in the average year).

Book Value VW 1926 to 2013

These returns are considerably lower than the returns found for the price-to-earnings and cashflow ratios over the last few weeks (see Investing Using the Price-to-Earnings Ratio and Earnings Yield (Backtests 1951 to 2013) and Investing Using Price-to-Cashflow Ratio and Cashflow Yield (Backtests 1951 to 2013)). The reason is that the earnings and cashflow backtests ran back to only 1951, and the book value return data begins in 1926. The difference is due to the 1929 crash, which had an oversized impact on returns. The impact of the crash is visible on the chart, and striking–it took twenty years for the value decile to fully recover. Something similar has happened to the glamour decile since 2000–it hasn’t grown in 13 years.

To make a comparison possible of book value’s performance to the performance of earnings and cashflow over the same period, I also measured the returns beginning in 1951. Since 1951 the low PB value decile has generated a compound annual growth rate (CAGR) of 15.0 percent and an average annual return (AAR) of 17.9 percent. Over the same period the glamour decile returned a CAGR of 9.6 percent and an AAR of 12.6 percent. These returns are approximately the same as the returns generated by PCF and PE over the same period.

BE/ME (Market Capitalization Weight)

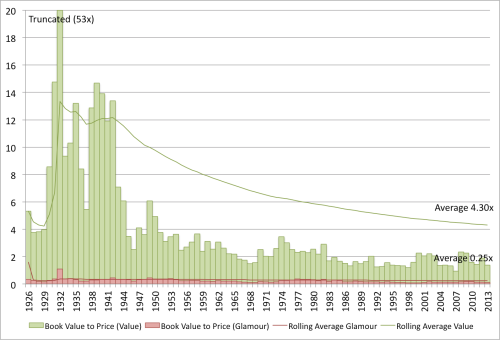
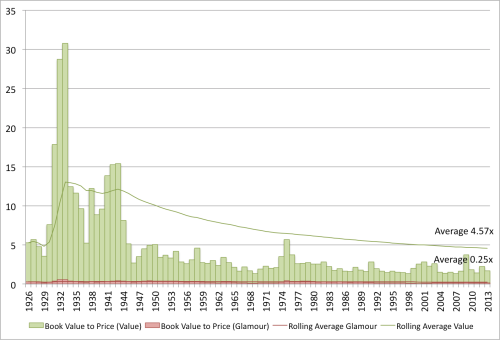
The reason for value’s outperformance is simply due to the fact that the value portfolios bought more book value per dollar invested: 4.3x versus 0.25x for the glamour portfolio. (I used a rolling average. The “average” I’ve quoted is for the full period. The rolling average has been higher, but it’s rarely been lower.) This chart shows the extraordinary bargains available for twenty years following the 1929 crash:

Book Value to Market VW 1926 to 2013

Recent Performance (Market Capitalization Weight)

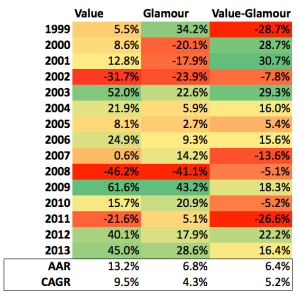
As we’ve seen over the last few weeks, value’s outperformance over glamour is not a historical artifact. If we examine just the period since 1999, we find that the return is higher than the long term average to 1926, and value has continued to be the better bet.

VW PB Returns 1999 to 2013

Though it started out almost 30 percent behind in 1999, value outperformed glamour over the period since 1999, beating it by 5.2 percent compound, and 6.4 percent in the average year.

As I noted last week, market capitalization-weighted returns are useful for demonstrating that the outperformance of value over glamour is not due to the value portfolios containing smaller stocks. Unless you’re running an index (or hugging an index), they’re not really meaningful. The easiest portfolio weighting scheme is to simply equally weight each position. (If we’re prepared to put up with a little extra volatility for a little extra return, we can also Kelly weight our best ideas). Here are the equal weight return statistics for book value.

Annual and Compound Returns (Portfolio Constituents Equally Weighted)

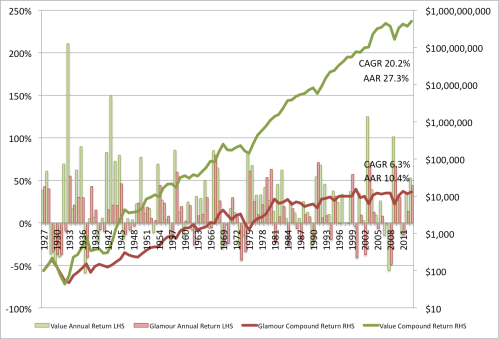
Book Value EW 1926 to 2013

In the equal weight backtest value generated 20.2 percent compound (27.3 percent on average), beating out glamour’s 6.3 percent compound return (10.4 percent on average).

Since 1951 the equally weighted PB value decile has generated a compound annual growth rate (CAGR) of 20.0 percent and an average annual return (AAR) of 25.4 percent. Over the same period the glamour decile returned a CAGR of 6.4 percent and an AAR of 10.8 percent. These returns are approximately the same as the returns generated by PCF and PE over the same period.

Book Value-to-Market Equity (Equal Weight)

Book Value to Market EW 1926 to 2013

Again, the value portfolios outperformed because they bought more book value per dollar invested than the glamour portfolios: 4.57x on average versus 0.25x  in the glamour portfolios.

Recent Performance (Equal Weight)

EW PB Returns 1999 to 2013

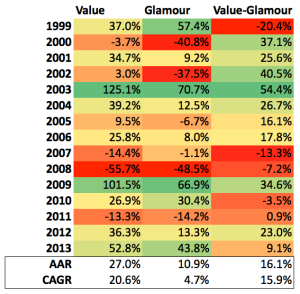
In the equal weight portfolios, value has really outperformed glamour since 1999, beating it by an extraordinary 15.9 percent compound, and 16.1 percent in the average year.

As we’ve seen over the last few weeks, over the long run, and with some regularity, cheap stocks tend to outperform more expensive stocks. Like the PE and PCF ratios, the PB ratio is a very useful metric for sorting cheap stocks from expensive stocks.

My firm, Eyquem, offers low cost, fee-only managed accounts that implement a systematic deep value investment strategy. Please contact me by email at toby@eyquem.net or call me by telephone on (646) 535 8629 to learn more.

Click here if you’d like to read more on Quantitative Value, or connect with me on LinkedIn.

Read Full Post »

The price-to-cashflow ratio (PCF) is a popular metric among value investors. Many believe that using cashflow, rather than accounting earnings, delivers a truer picture of a company’s business performance, which in turn leads to better investment performance.

Set out below are the results of two Fama and French backtests of the cashflow yield (the inverse of the PCF ratio) data from 1951 to 2013. As at December 2013, there were 2,526 firms in the sample. The value decile contained the 269 stocks with the highest earnings yield, and the glamour decile contained the 311 stocks with the lowest earnings yield. The average size of the glamour stocks is $4.74 billion and the value stocks $4.80 billion. (Note that the average is heavily skewed up by the biggest companies. For context, the 2,526th company has a market capitalization today of $272 million, which is much smaller than the average, but still investable for most investors). Stocks with negative cashflow were excluded. Portfolios are formed on June 30 and rebalanced annually.

Annual and Compound Returns (Portfolio Constituents Weighted by Market Capitalization)

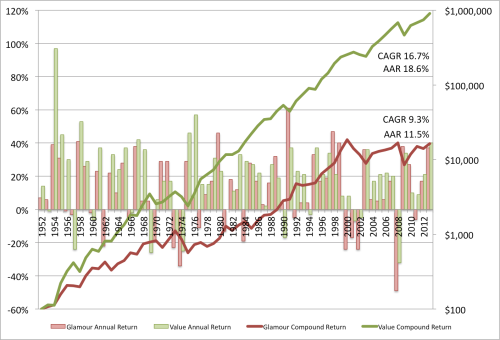
In this backtest, the two portfolios are weighted by market capitalization, which means that bigger firms contribute more to the performance of the portfolio, and smaller firms contribute less. Here we can see that the value decile has comprehensively outperformed the glamour decile, returning 16.7 percent compound (18.6 percent in the average year) over the full period versus 9.3 percent for the glamour decile (11.5 percent in the average year).

VW PCF Returns 1951 to 2013 v2

These returns are practically identical to the returns found for the price-to-earnings ratio in last week’s post (Investing Using the Price-to-Earnings Ratio and Earnings Yield (Backtests 1951 to 2013)).

Cashflow Yield (Market Capitalization Weight)

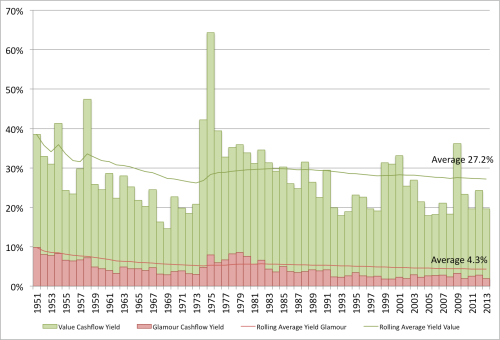
The reason for value’s outperformance is simply due to the fact that the value portfolios generated more cashflow per dollar invested; 27.2 percent versus 4.3 percent for the glamour portfolio. (I used a rolling average this week. The “average” I’ve quoted is for the full period. The rolling average has been higher, but it’s rarely been lower.):

Cashflow Yield VW 1951 to 2013

Recent Performance (Market Capitalization Weight)

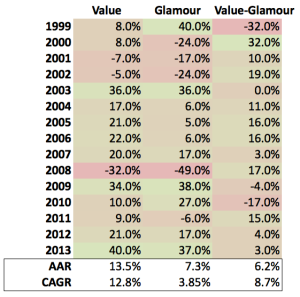
As we saw last week, value’s outperformance over glamour is not a historical artifact. If we examine just the period since 1999, we find that, though the return is lower than the long term average, value has continued to be the better bet.

VW PCF Returns 1999 to 2013

Value has continued to outperform glamour since 1999, beating it by 8.7 percent compound, and 6.2 percent in the average year. The reason for lower returns recently may be due to the popularization of simple value strategies, but I think it’s more because the market is still working off the massive overvaluation of the late 1990s Dot Com boom.

As I noted last week, market capitalization-weighted returns are useful for demonstrating that the outperformance of value over glamour is not due to the value portfolios containing smaller stocks. Unless you’re running an index (or hugging an index), they’re not really meaningful. The easiest portfolio weighting scheme is to simply equally weight each position. (If we’re prepared to put up with a little extra volatility for a little extra return, we can also Kelly weight our best ideas). Here are the equal weight return statistics for the cashflow yield.

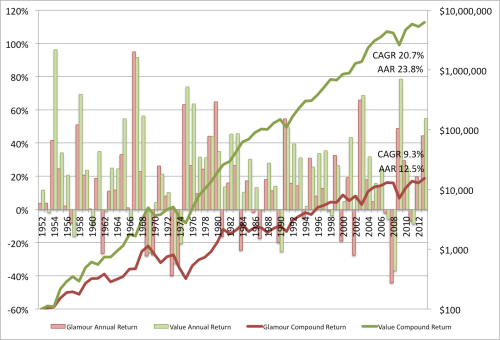
Annual and Compound Returns (Portfolio Constituents Equally Weighted)

EW PCF Returns 1951 to 2013 v2

In the equal weight backtest value generated 20.7 percent compound (23.8 percent on average), beating out glamour’s 9.3 percent compound return (12.5 percent on average). Folks who saw last week’s post might note the small advantage for the cashflow yield’s value decile over the earnings yield’s value decile, 20.7 percent versus 20.1 percent. We’ll examine the significance of this small win by cashflow in the coming weeks.

Cashflow Yield (Equal Weight)

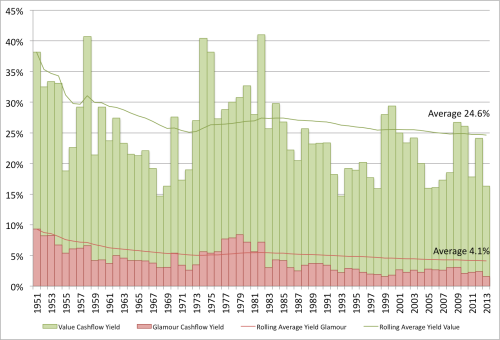
Cashflow Yield EW 1951 to 2013

Again, the value portfolios generate more cashflow than the glamour portfolios, generating 24.6 percent on average versus 4.1 percent in the glamour portfolios. As we saw last week, the average cashflow yield for the equally weighed value portfolio is slightly lower than the average cashflow yield for the market capitalization-weighted portfolios, which indicates that, over the full period, bigger stocks tended to be a cheaper method for buying cashflow than smaller stocks. That won’t always be the case, but it’s interesting nonetheless.

Recent Performance (Equal Weight)

EW PCF Returns 1999 to 2013

In the equal weight portfolios, value has really outperformed glamour since 1999, beating it by 11.1 percent compound, and 10.0 percent in the average year.

As we saw last week, over the long run, cheap stocks tend to outperform more expensive stocks. Like the PE ratio, the PCF ratio is a very useful metric for sorting cheap stocks from expensive stocks.

My firm, Eyquem, offers low cost, fee-only managed accounts that implement a systematic deep value investment strategy. Please contact me by email at toby@eyquem.net or call me by telephone on (646) 535 8629 to learn more.

Click here if you’d like to read more on Quantitative Value, or connect with me on LinkedIn.

Read Full Post »