The Hong Kong University of Science and Technology Value Partners Center for Investing has examined the performance of value stocks in the Japanese stock market over the period January 1975 to December 2011. They have also broken out the performance of value stocks during Japan’s long-term bear market over the 1990 to 2011 period, when the stock market dropped 62.21 percent.
The white paper Performance of Value Investing Strategies in Japan’s Stock Market examines the performance of equal-weight and market capitalization weighted quintile portfolios of five price ratios–price-to-book value, dividend yield, earning-to-price, cash flow-to-price, and leverage-to-price—excluding the smallest 33 percent of stocks by market capitalization.
The portfolios were rebalanced monthly over the full 37 years.
The authors find the value quintile of equal-weighted portfolios book-to-market, dividend yield, earning-to-price, cash flow-to-price, and leverage-to-price generated monthly returns of 1.48 percent (19.3 percent per year), 1.34 percent (17.3 percent per year), 1.78 percent (23.6 percent per year), 1.66 percent (21.8 percent per year) and 0.78 (9.8 percent per year) percent in the 1975–2011 period.
The returns diminished over the 1990 to 2011 period. The value quintile of equal-weighted portfolios book-to-market, dividend yield, earning-to-price, cash flow-to-price, and leverage-to-price generated monthly returns of 0.84 percent (10.6 percent per year), 0.78 percent (9.8 percent per year), 1.31 percent (16.9 percent per year), 1.13 percent (14.4 percent per year) and 0.0 percent (0.0 percent per year) in the 1990–2011 period, respectively. In contrast, the Japanese stock market lost 62.21 percent.
They find similar results for market capitalization-weighted portfolios sorted by these measures, as well as for three-, six-, nine-, and twelve-month holding periods (excluding the leverage-to-price ratio).
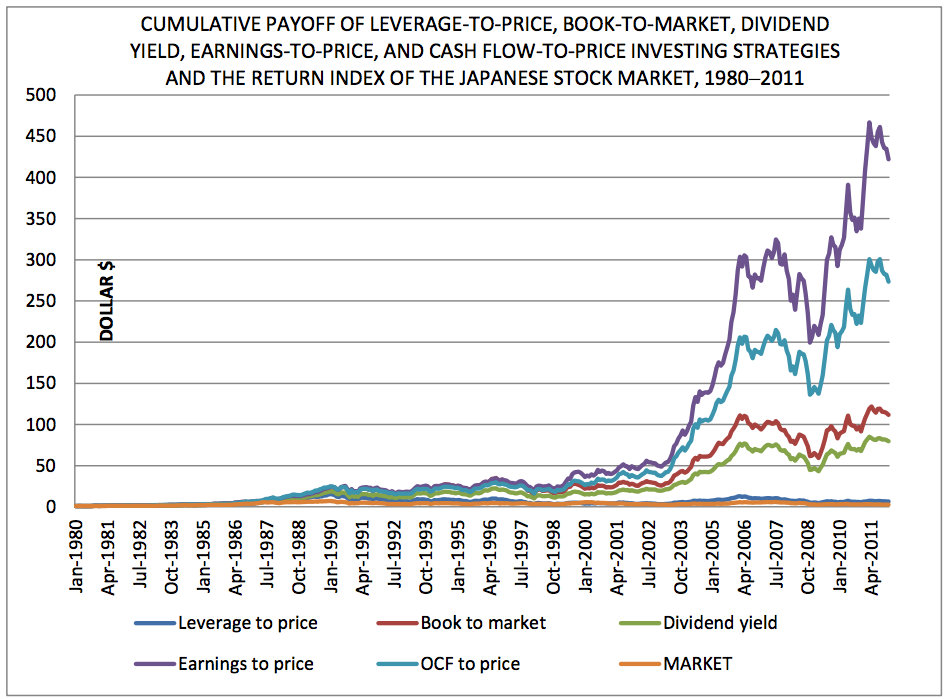
They also investigated the cumulative payoff in dollar terms of investing $1 in the portfolios having the highest values of our value measures with monthly portfolio rebalancing in the 1980–2011 period. Value investing strategies based on stock’s book-to-market, dividend yield, earning-to-price , cash flow-to-price , and leverage-to-price grew $1 into $115.98, $81.88, $433.86, $281.49, and $6.62 respectively, while the aggregate stock market turned $1 into a mere $2.76, in the 1980–2011 period. This implies that these value investing strategies rewarded investors 42.0, 29.6, 157, 102 and 2.40 times what the Japanese stock market did. The effective monthly compound returns of the various investing strategies are 1.25 percent, 1.16 percent, 1.60 percent, 1.48 percent and 0.49 percent, while the aggregate stock market only delivered 0.27 percent in this period.
Four out of five value investing strategies actually rewarded investors with positive returns in the bear market that spanned two decades from 1990 to 2011, turning $1 into $4.77, $4.25, $17.17, and $10.91, implying profits of 377 percent, 325 percent, 1617 percent, and 991 percent respectively, while the stock market plunged 62.21 percent after reaching its peak in January 1990. In addition, every one of these value investing strategies continued to generate positive returns between the pre-global financial crisis peak in 2007 and December 2011.
Order Quantitative Value from Wiley Finance, Amazon, or Barnes and Noble.
Click here if you’d like to read more on Quantitative Value, or connect with me on LinkedIn.


Does anyone know of a firm or a fund that actually managed to achieve returns in line with these results in Japan?
LikeLike
[…] value investing work during the long Japanese depression […]
LikeLike
[…] than have a debate on the (de)merits of Japanese equities, let’s look at the evidence. Greenbackd.com just featured a study on returns for 5 value investing strategies in Japan from 1990 …. The article reports that during a period when the market lost 62.2%, 4 of the 5 value […]
LikeLike
[…] Has value investing worked in Japan’s long bear market (1990 to 2011)? (Greenbackd) […]
LikeLike
I’ve just read the (brief) paper, and am happy with the research methods employed. I read it as though they are chopping the bottom third of “each month” – so all is fine there.
The value weighted results being provided (not just equal weight) also adds confidence.
A great and valuable study!
LikeLike
Henry and Ardaman – Toby kindly shared research he found. He doesn’t have to do that. It might be helpful to try and find and add the constructive info you ask for to build on the conversation rather than create a disincentive for Toby to continue is extraordinarily generous practice of sharing.
LikeLike
I love this piece of research as it confirms Asness research on Japan and the “value and momentum everywhere” phenomenon. Those from the “value only” camp might not know, but Japan is/was a thorn in the side of the momentum camp (Japan is where momentum didn’t work, and no-one knew why). Value does work in Japan though, giving a nice justification to those who disregard loyalty to either camp (of value or momentum) and embrace both. Asness showed that an investor was better off using value and momentum together, even in Japan…even when momentum didn’t work!
LikeLike
Hi Tobias, that’s correct. All backtests need to account for survivorship by including all delisted stocks. Not eliminate them. For this particular study, the bias is especially large due to the value criterion.
LikeLike
Henry, It’s not correct that simply eliminating the bottom third of stocks by market capitalization introduces survivorship bias. Survivorship bias is a function of a database that doesn’t maintain data on delisted stocks. Do you have some specific insight into this paper? They are clear about the database used.
Any study that doesn’t deal with small and illiquid stocks is highly suspect. It’s standard to eliminate smaller stocks. If anything, they haven’t eliminated enough of the smaller stocks, but they’ve provided the market capitalization weighted returns, so this is ameliorated somewhat.
LikeLike
It depends on how they’re eliminating the bottom third. If they’re doing it on a rolling basis then it is okay. If they’re eliminating the bottom one third from their entire testing period first prior to their walk forward testing then that would be a problem. Also, although it says Datastream is the source, they do not explicitly say that delisted stocks are included in the walk forward tests.
LikeLike
This might assist you: Harvard’s guide to Datastream.
LikeLike
I’m not sure why you’re suggesting I read the Datastream guide. My previous questions can only be answered by the authors of that paper. The disagreement comes from the fact that you assume the authors used the right methodology when no such information is explicitly specified in the paper. Datastream contains delisted does not imply that the authors took the effort to take delisted stocks into account in their backtest because in terms of programming it is indeed an extra step.
LikeLike
Hence why I asked several times if you had some specific insight into the study. You seem to be implying that they have treated the data in an incorrect or unusual way, but there’s nothing to suggest it in the paper.
LikeLike
That is not how it works, Mr. Carlisle. It is the responsibility to convince the reader that the study has been done properly. With such eye popping results and no mention of bias issues the question does indeed arise whether there is something wrong with the study methodology.
LikeLike
Surely you have to have a reasonable basis for concluding that something was amiss?
LikeLike
extraordinary claims require extraordinary evidence
LikeLike
Because successful investing is simply picking stocks based on metrics we all get on reuters or bloomberg and then allocating… Sure!?!
The burden of proof lies on the authors of the study, who then put the study out for peer review; where the methodology should be questioned and critiqued. I’m quite disappointed Tobias that you would not understand this process and challenge those who would question it. Makes me think your school of thought is more of a religion than a methodology, probably why Sam above me quoted Christopher Hitchens.
The results do not look like unbiased objective data. As far as I’m concerned the authors should clarify… In other words, clarification or it didn’t happen.
LikeLike
I found an interesting article, summarized it and attached it to the post for anyone to read. One commenter misunderstood the effect of truncating the smallest third of stocks by market capitalization believing that it introduced survivorship bias, which is just plain wrong (Truncating the smallest third will lower returns, not increase them). I make no claims about the paper. You need not rely on my summary. You are free to read the paper yourself, or contact the paper’s author, and draw your own conclusion.
LikeLiked by 1 person
nice work!
LikeLike
The study has a significant survivorship bias because the author eliminates all the penny stocks. Value strategies are especially sensitive to survivorship bias because value companies become delisted more often than growth companies.
LikeLike
Are you saying that any study that eliminates the bottom third of stocks imports survivorship bias, or do you have some specific insight into this particular study?
LikeLike