Feeds:
Posts
Comments

Archive for the ‘Contrarian investment’ Category

Cliff Asness, founder of AQR, seems to be doing the rounds lately. Forbes has a great interview with him called Efficient Market? Baloney, Says Famed Value And Momentum Strategist Cliff Asness.

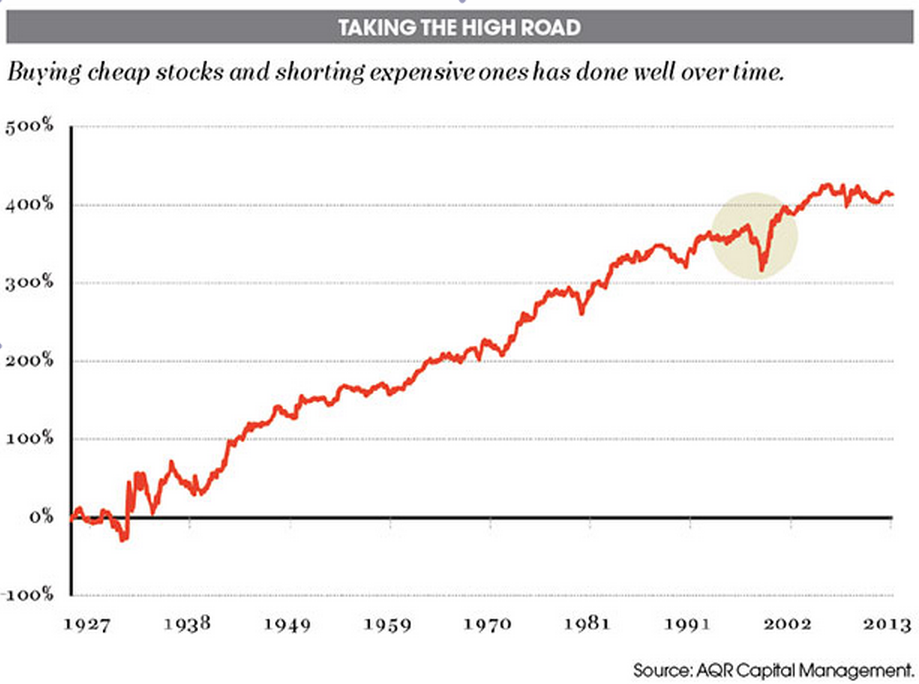
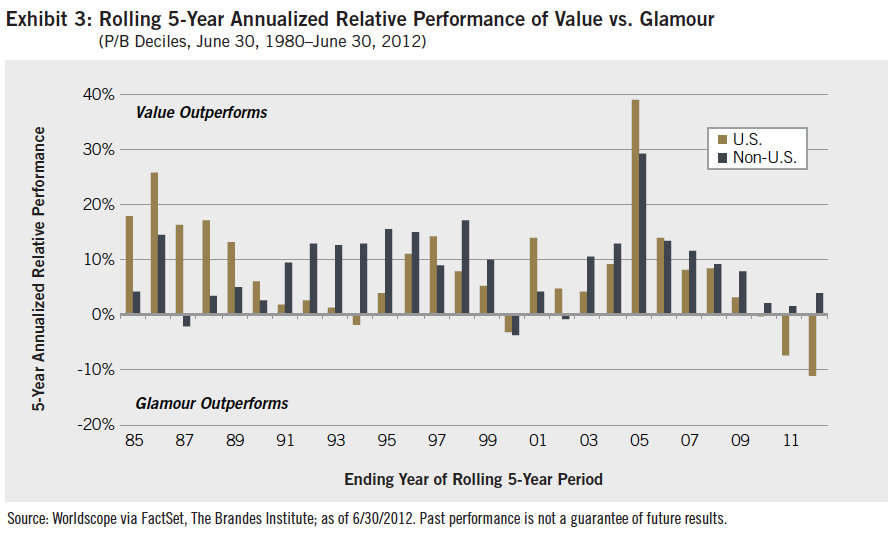
Here’s Asness talking about the outperformance of value:

Forbes: Isn’t it all about probabilities? You can’t predict the future, but do you feel you can find patterns that generally hold up?

Asness: It’s all about probabilities. And I love that you put it that way. I don’t think it’s different necessarily for non-quantitative firms. We just might acknowledge it a little more explicitly. But I’m in a business where if 52% of the day I’m right, I’m doing pretty well over the long term. That’s not so easy to live with on a daily basis. I like to say, when I say a strategy works, I kind of mean six or seven out of 10 years. A little more than half the days. If your car worked like this you’d fire your mechanic. But we are playing the odds. Some famous findings, cheap stocks, defined simply, price-to-book, cash flow, sales.

You can try to do better, but define it simply. Beat expensive stocks. They beat them on average with a small margin and you want to own a ton of them and be underweight or short a ton of the expensive ones because something like this for one stock means almost nothing.

On active versus passive investment, and the central paradox of efficient markets:

Forbes: How do you defend your approach? Not in the specifics, but the whole thing on indexing. We all know Malkiel and others, Charlie Ellis, will tell you that if you have the discipline to stick to an index, low fees. Your fees are relatively high. Wouldn’t you just be better off saving all that brain power and just riding the wave?

Asness: Sure. Off the bat I’ll tell you my two investing heroes, and there are a lot of good ones to choose from, are Jack Bogle and my dissertation advisor, Gene Fama. So I can’t sit here and put down indexing too much. And in fact when I’m asked, “What advice would you give individuals who are not going to dedicate themselves to this and what not,” I tell them, “The market might not be perfectly efficient, but for most people acting as if it is,” and this is not the only way to get to an index fund, but it’s one route to get to it, it’s certainly one route that implies an index fund. I tell them to do that.

Having said that, there are a lot of ways to get here, but there’s a central paradox to efficient markets. Efficient markets says you can’t beat an index, the price contains all the information. For a long time we’ve known, academics have known, that somebody has to be gathering that information. The old conundrum: What if everyone indexed? Prices would be wildly inefficient.

So I do take what ends up being an arrogant view, and I admit it, that on average people don’t beat the index. Here are the mistakes they make. Here are the risk premiums you can pick up. I do think it’s somewhat profitable, and we want to be some of the people helping make the markets efficient and we think you get paid for that. So that is both how I reconcile it and how I sleep at night.

But if an individual came to me and said, “What should I do?” I don’t say, “Pour your money into my fund,” because, for one thing, they don’t know that much and if we have a bad year they won’t stick with it. I tell them, “Study the history a little bit, just a little bit, and put it in the most aggressive mix of stocks and bonds that you wouldn’t have thrown up and left in the past. And go to Jack Bogle to get it.”

On quantitative value as practiced by AQR:

Forbes: Quickly go over what you call the four styles of investing, starting with value.

Asness: …

And that’s kind of the holy grail of investing. To find various investments, of course, and I know you know this, that go up over time — there’s no substitute for going up — but that go up at different times.

To us, the academic literature has produced a ton. If you want to be a cynic, they’ve produced too many. A lot of smart people with even smarter computers will turn out a lot of past results and we have hundreds of different effects. The blank effect. The silliest ones are things like the Super Bowl, the sunspot effect.

But when someone searches every piece of data and it’s not that silly, it involves an accounting variable, even if ultimately it’s silly when you drill down, it’s harder to dismiss. What we did was kind of almost a self examination of going through and saying, “Of all these things we’ve been reading about for years, many of which we’ve been implementing, if we had to bet the ranch,” now we’re quant, so we never bet the single ranch on anything but over the long-term, if we had to really say, “What are the biggies that we would be most confident in?” They have to have worked for the long term. Data still counts. They need to have great intuition. They have to have worked out of sample, that thing I was talking about before, after they’ve been discovered. If they were discovered in 1970, how’d they do after that? A telltale sign of something that was dredged out of the data is discovered in 1970. Wonderful for the first 70 years of the century and terrible for the last 30 years.

And it has to be implementable. Meaning, there are some things that academics and others look at that when you try with real world transactions cost in a real world portfolio, you find, “Gee, gross, I made a lot of money but net Wall Street made a lot of money. I didn’t make a lot of money.”

Came down to four. Value. Cheap beats expensive. Famous is in U.S. stocks. For me it’s very related to Graham and Dodd value. It’s the same intuition. But where most Graham and Dodd investors will use it to pick a handful of stocks we’ll say the thousand cheapest on our favorite measures will beat the thousand most expensive. We’re betting on a concept more than a specific firm, but looking for the same ideas.

I still think of value as the hero of the story. You’re a manager long cheap and short expensive. I’m the momentum heretic. I’m long good momentum, short bad momentum. A good year for you is usually not my best year. Think about it. It works in the math but also in spirit. When value’s being rewarded you would not think it’s a particularly good time for momentum.

If there’s any magic to the finding, and I’m still amazed by it, is while we hedge each other a bit, more than a bit, both of us make money if we follow it with discipline over time.

Read Forbes’ Efficient Market? Baloney, Says Famed Value And Momentum Strategist Cliff Asness.

Click here to read earlier articles on Asness, AQR’s Value Strategies In Practice or On The Great Shiller PE Controversy: Are Cyclically-Adjusted Earnings Below The Long-Term Trend?.

Click here if you’d like to read more on Quantitative Value, or connect with me on LinkedIn.

Read Full Post »

Institutional Investor has a great piece from Clifford Asness and John Liew called The Great Divide over Market Efficiency on the efficient markets debate. Most interesting for me was their discussion on the launch of AQR and the “value” strategies it employs:

Starting in the mid-1980s, researchers began investigating simple value strategies. That’s not to say value investing was invented at that time. We fear the ghosts of Benjamin Graham and David Dodd too much to ever imply that. This was when researchers began formal, modern academic studies of these ideas. What they found was that Graham and Dodd had been on to something. Stocks with lower price multiples tended to produce higher average returns than stocks with higher price multiples. As a result, the simplest diversified value strategies seemed to work. Importantly, they worked after accounting for the effects of CAPM (that is, for the same beta, cheaper stocks still seemed to have higher expected returns than more expensive stocks). The statistical evidence was strong and clearly rejected the joint hypothesis of market efficiency and CAPM.

We started our careers in the early 1990s, when as a young team in the asset management group at Goldman, Sachs & Co. we were asked to develop a set of quantitative trading models. Why they let a small group of 20-somethings trade these things we’ll never know, but we’re thankful that they did. Being newly minted University of Chicago Ph.D.s and students of Gene Fama and Ken French, the natural thing for us to do was develop models in which one of the key inputs was value. …

Asness Long Short Value v2

Above is a graph of the cumulative returns to something called HML (a creation of Fama and French’s). HML stands for “high minus low.” It’s a trading strategy that goes long a diversified portfolio of cheap U.S. stocks (as measured by their high book-to-price ratios) and goes short a portfolio of expensive U.S. stocks (measured by their low book-to-price ratios). The work of Fama and French shows that cheap stocks tend to outperform expensive stocks and therefore that HML produces positive returns over time (again, completely unexplained by the venerable CAPM). The graph above shows this over about 85 years.

If you notice the circled part, that’s when we started our careers. Standing at that time (before the big dip you see rather prominently), we found both the intuition and the 65 years of data behind this strategy pretty convincing. Obviously, it wasn’t perfect, but if you were a long-term investor, here was a simple strategy that produced positive average returns that weren’t correlated to the stock market. Who wouldn’t want some of this in their portfolio?

Fortunately for us, the first few years of our live experience with HML’s performance were decent, and that helped us establish a nice track record managing both Goldman’s proprietary capital, which we began with, and the capital of some of our early outside investors. This start also laid the groundwork for us to team up with a fellow Goldman colleague, David Kabiller, and set up our firm, AQR Capital Management.

As fate would have it, we launched our first AQR fund in August 1998. You may remember that as an uneventful little month containing the Russian debt crisis, a huge stock market drop and the beginning of the rapid end of hedge fund firm Long-Term Capital Management. It turned out that those really weren’t problems for us (that month we did fine; we truly were fully hedged long-short, which saved our bacon), but when this scary episode was over, the tech bubble began to inflate.

We were long cheap stocks and short expensive stocks, right in front of the worst period for value strategies since the Great Depression. Imagine a brand-new business getting that kind of result right from the get-go. Not long cheap stocks alone, which simply languished, but long cheap and short expensive! We remember a lot of long-only value managers whining at the time that they weren’t making money while all the crazy stocks soared. They didn’t know how easy they had it. At the nadir of our performance, a typical comment from our clients after hearing our case was something along the lines of “I hear what you guys are saying, and I agree: These prices seem crazy. But you guys have to understand, I report to a board, and if this keeps going on, it doesn’t matter what I think, I’m going to have to fire you.” Fortunately for us, value strategies turned around, but few know the limits of arbitrage like we do (there are some who are probably tied with us).

On the question of market efficiency, years as practitioners have put Asness and Liew somewhere between Fama and Shiller:

We usually end up thinking the market is more efficient than do Shiller and most practitioners — especially, active stock pickers, whose livelihoods depend on a strong belief in inefficiency. As novelist Upton Sinclair, presumably not a fan of efficient markets, said, “It is difficult to get a man to understand something, when his salary depends upon his not understanding it!” However, we also likely think the market is less efficient than does Fama.

After backtesting countless “value” and fundamental strategies for our book Quantitative Value I found myself in the same boat. There exist some strategies that, over the long term, lead to a consistent, small margin over market, but fewer work than most believe, and our own efforts to cherry pick the model inevitably lead to underperformance.

Click here to read The Great Divide over Market Efficiency and here if you’d like to read more on Quantitative Value, or connect with me on LinkedIn.

Read Full Post »

Jason Zweig has a great blog post about Dean LeBaron, founder of Batterymarch Financial Management, and pioneer of quantitative investing: the use of statistical analyses rather than human judgment to pick stocks. Batterymarch’s Dean Williams delivered the incredible “Trying Too Hard” speech from 1981, which is required reading if you’re interested in behavioral investment:

I had just completed what I thought was some fancy footwork involving buying and selling a long list of stocks. The oldest member of Morgan’s trust committee looked down the list and said, “Do you think you might be trying too hard?” A the time I thought, “Who ever heard of trying too hard?” Well, over the years I’ve changed my mind about that. Tonight I’m going to ask you to entertain some ideas whose theme is this: We probably are trying too hard at what we do. More than that, no matter how hard we try, we may not be as important to the results as we’d like to think we are.

LeBaron, 80 years old, spoke to Zweig from his home near Sarasota, Fla. He believes that the name of the game for investors has been to make as much money as possible, but from now on, the prime directive will be to “lose as little money as possible.” 

If we are in a transition period, then the person who is in the most danger is the one who has recently done well, because he’s done well on things that are about to change.

In complex systems, the dynamics are predictable but the timing isn’t. It’s like adding a grain of sand one at a time to a pile: You can’t tell when it will collapse, but you know it will.

The highlight for me is this story about one of Mr. LeBaron’s most successful techniques at Batterymarch. Every year he ran a contest to see who could pick the stocks that would perform worst–not best–over the next year. Mr. LeBaron then went out and bought them all–more than 100 at a time–believing that if you can hold on for several years:

You should make enough on the ones that don’t go bankrupt to make up for the ones that do.

It’s harder than it sounds.

Read Jason Zweig’s blog post about Dean LeBaron.

Order Quantitative Value from Wiley FinanceAmazon, or Barnes and Noble.

Click here if you’d like to read more on Quantitative Value, or connect with me on LinkedIn.


Read Full Post »

A great piece from MebFaber on the probabilistic median real returns to different CAPE levels:

1

An ugly period for US equities approaches.

Read Probabilistic Investing.

Read Full Post »

The Hong Kong University of Science and Technology Value Partners Center for Investing has examined the performance of value stocks in the Japanese stock market over the period January 1975 to December 2011. They have also broken out the performance of value stocks during Japan’s long-term bear market over the 1990 to 2011 period, when the stock market dropped 62.21 percent.

The white paper Performance of Value Investing Strategies in Japan’s Stock Market examines the performance of equal-weight and market capitalization weighted quintile portfolios of five price ratios–price-to-book value, dividend yield, earning-to-price, cash flow-to-price, and leverage-to-priceexcluding the smallest 33 percent of stocks by market capitalization.

The portfolios were rebalanced monthly over the full 37 years.

The authors find the value quintile of equal-weighted portfolios book-to-market, dividend yield, earning-to-price, cash flow-to-price, and leverage-to-price generated monthly returns of 1.48 percent (19.3 percent per year), 1.34 percent (17.3 percent per year), 1.78 percent (23.6 percent per year), 1.66 percent (21.8 percent per year) and 0.78 (9.8 percent per year) percent in the 1975–2011 period.

The returns diminished over the 1990 to 2011 period. The value quintile of equal-weighted portfolios book-to-market, dividend yield, earning-to-price, cash flow-to-price, and leverage-to-price generated monthly returns of  0.84 percent (10.6 percent per year), 0.78 percent (9.8 percent per year), 1.31 percent (16.9 percent per year), 1.13 percent (14.4 percent per year) and 0.0 percent (0.0 percent per year) in the 1990–2011 period, respectively. In contrast, the Japanese stock market lost 62.21 percent.

They find similar results for market capitalization-weighted portfolios sorted by these measures, as well as for three-, six-, nine-, and twelve-month holding periods (excluding the leverage-to-price ratio).

They also investigated the cumulative payoff in dollar terms of investing $1 in the portfolios having the highest values of our value measures with monthly portfolio rebalancing in the 1980–2011 period. Value investing strategies based on stock’s book-to-market, dividend yield, earning-to-price , cash flow-to-price , and leverage-to-price grew $1 into $115.98, $81.88, $433.86, $281.49, and $6.62 respectively, while the aggregate stock market turned $1 into a mere $2.76, in the 1980–2011 period. This implies that these value investing strategies rewarded investors 42.0, 29.6, 157, 102 and 2.40 times what the Japanese stock market did. The effective monthly compound returns of the various investing strategies are 1.25 percent, 1.16 percent, 1.60 percent, 1.48 percent and 0.49 percent, while the aggregate stock market only delivered 0.27 percent in this period.

Japan Value

Four out of five value investing strategies actually rewarded investors with positive returns in the bear market that spanned two decades from 1990 to 2011, turning $1 into $4.77, $4.25, $17.17, and $10.91, implying profits of 377 percent, 325 percent, 1617 percent, and 991 percent respectively, while the stock market plunged 62.21 percent after reaching its peak in January 1990. In addition, every one of these value investing strategies continued to generate positive returns between the pre-global financial crisis peak in 2007 and December 2011.

Order Quantitative Value from Wiley FinanceAmazon, or Barnes and Noble.

Click here if you’d like to read more on Quantitative Value, or connect with me on LinkedIn.

Read Full Post »

The CFAInstitute blog Inside Investing has a great post on the returns to negative enterprise value stocks. Alon Bochman, CFA has investigated the performance of all negative enterprise value (“EV”) stocks trading in the United States between March 30, 1972 and September 28, 2012. He used balance sheet data from Standard & Poor’s Compustat database and merged these data with price data from the database maintained by the Center for Research in Security Prices (CRSP). He then calculated historical EVs for every company every month, as well as matching forward 12-month returns. Says Alon:

I found 2,613 stocks that at one point or another traded at a negative enterprise value between 1972 and 2012 (Microsoft, unfortunately, was not among them). The list has one entry per stock-month. That is, a stock that has traded at a negative enterprise value three months in a row will appear on the list three times. Each time is a different investment opportunity with its own forward 12-month return. The average stock spent 10.17 months (not necessarily consecutive) in negative EV territory. Thus, the list shows a total of 26,569 opportunities to invest in negative EV stocks.

The average return across all 26,569 opportunities was 50.4%. That is, if you had diligently watched the market over the last 40 years and invested $1,000 into each negative EV stock each month, your average investment would be worth $1,504 after holding that investment for one year, not including trading costs, taxes, and so on. Not bad!

Most of the opportunities are in micro caps with limited liquidity:

Returns by Market Cap -- Negative EV Investing

Alon notes that these opportunities have come up with some regularity and have usually provided attractive returns but have on occasion lost a great deal as well:

Average 12M Returns on Negative EV Stocks by Entry Year

Read Returns on Negative Enterprise Value Stocks: Money For N0thing?

Order Quantitative Value from Wiley FinanceAmazon, or Barnes and Noble.

Click here if you’d like to read more on Quantitative Value, or connect with me on LinkedIn.

Read Full Post »

Further to this post Value Badly Lagging Glamour: The Value Premium Is Now A Discount Saj Karsan requested a calculation showing the value premium using EBIT/EV:

This chart shows the average annual value premium calculated using EBIT / EV (decile 10 — decile 1) from the largest 50 percent of non-financial stocks listed in the US for the period 1999 to present.

EBIT Value PremiumThe horizontal red line is the average EBIT/EV value premium for the period at 5.4 percent. 2009 aside, the value premium has been negative since 2007 (although there is a very small premium for the incomplete 2013 year to date). Even so, the magnitude of the return in 2009 means that, in aggregate since 2007, the value premium is still slightly positive.

Order Quantitative Value from Wiley FinanceAmazon, or Barnes and Noble.

Click here if you’d like to read more on Quantitative Value, or connect with me on LinkedIn.

Read Full Post »

Two interesting charts from The Brandes Institute’s annual Value versus Glamour update for 2013. The first exhibit (2) shows the disappearance of the value premium over the last five years, and its inversion over the last two years. The yellow dotted line shows the average returns to the ten decile portfolios of stocks ranked by price-to-book value from 1968 to 2012. It demonstrates that, historically, the higher the price-to-book value, the lower the returns. The differential between the returns to the stocks in decile 10 (the “value” portfolio) and decile 1 (the “glamour” portfolio) is the value premium. That relationship seems to have broken down since 2007 (shown in blue), and inverted since 2010 (shown in red). The value premium is now a value discount!US Value Premium

The second exhibit (3) shows the rolling five-year annualized relative performance of value over glamour. In the last two rolling five-year periods, value stocks in the U.S.–marked in yellow–have delivered their worst relative performance in the 32 years of data from 1980. The Non-U.S. value stocks have continued to outperform.Rolling Five-Year Value versus GlamourAs the second exhibit demonstrates, it’s unusual for value to underperform glamour by so much and for so long. The last period of underperformance occurred in 2000, and it wasn’t as deep or prolonged. One possible explanation is that low p/b value strategies are now so well known and low p/b value stocks are so picked over that value investors have to do something special to outperform. More likely is that this is a brief period of underperformance at the tail end of a bull market and the relative performance of value over subsequent periods will compensate.

Order Quantitative Value from Wiley FinanceAmazon, or Barnes and Noble.

Click here if you’d like to read more on Quantitative Value, or connect with me on LinkedIn.

Read Full Post »

Here’s the updated St Louis Fed’s FRED on Warren Buffett’s favored market measure, total market capitalization-to-GNP:

FRED Graph

The Q1 2013 ratio – the most recent point – is 110 percent.

According to the FRED data, the Q1 2000 TTM/GNP peak ratio was 158 percent, and the Q3 2007 TTM/GNP peak was 114 percent. The average for the full period – Q3 1949 to Q3 2012 – is 69 percent. The last time the market traded at a below-average ratio was Q1 2009.

Here’s the log version:

FRED Graph

Order Quantitative Value from Wiley FinanceAmazon, or Barnes and Noble.

Click here if you’d like to read more on Quantitative Value, or connect with me on LinkedIn.

Read Full Post »

In Is the AAII Sentiment Survey a Contrarian Indicator? Charles Rotblut, CFA asks if the AAII Sentiment Survey results signal future market direction.

Each week from Thursday 12:01 a.m. until Wednesday at 11:59 p.m. the AAII asks its members a simple question:

Do you feel the direction of the stock market over the next six months will be up (bullish), no change (neutral) or down (bearish)?

AAII members participate by visiting the Sentiment Survey page (www.aaii.com/sentimentsurvey) on AAII.com and voting.

Bullish sentiment has averaged 38.8% over the life of the survey. Neutral sentiment has averaged 30.5% and bearish sentiment has averaged 30.6% over the life of the survey.

In order to determine whether there is a correlation between the AAII Sentiment Survey and the direction of the market, Rotblut looked at instances when bullish sentiment or bearish sentiment was one or more standard deviations away from the average. He then calculated the performance of the S&P 500 for the following 26-week (six-month) and 52-week (12-month) periods. The data for conducting this analysis is available on the Sentiment Survey spreadsheet, which not only lists the survey’s results, but also tracks weekly price data for the S&P 500 index.

Table 2 from the article has the results:

Table 2. Performance of Sentiment Survey as a Contrarian Indicator

Sentiment Level Number of
Observations
Average
S&P 500
Change
(%)
Median
S&P 500
Change
(%)
% of
Periods
Correctly
Contrarian
(%)
6-Month Performance
Bullish > +3 S.D. From Mean
2.0
7.4
7.4
0.0
Bullish > +2 S.D. From Mean
44.0
-0.7
0.3
48.0
Bullish > +1 S.D. From Mean
167.0
0.8
2.9
34.0
Bullish < –1 S.D. From Mean
212.0
6.9
6.2
80.0
Bullish < –2 S.D. From Mean
16.0
14.0
17.7
100.0
Bearish > +3 S.D. From Mean
3.0
25.8
23.0
100.0
Bearish > +2 S.D. From Mean
50.0
2.8
5.3
60.0
Bearish > +1 S.D. From Mean
162.0
4.7
6.0
71.0
Bearish < –1 S.D. From Mean
211.0
3.8
4.5
26.0
Bearish < –2 S.D. From Mean
9.0
-5.5
-1.7
67.0
All
1,319.0
4.0
4.7
12-Month Performance
Bullish > +3 S.D. From Mean
2.0
3.6
3.6
50.0
Bullish > +2 S.D. From Mean
44.0
-2.0
3.6
48.0
Bullish > +1 S.D. From Mean
167.0
2.4
6.3
31.0
Bullish < –1 S.D. From Mean
206.0
12.9
14.3
84.0
Bullish < –2 S.D. From Mean
16.0
20.7
21.7
100.0
Bearish > +3 S.D. From Mean
3.0
35.0
25.6
100.0
Bearish > +2 S.D. From Mean
50.0
3.1
14.3
60.0
Bearish > +1 S.D. From Mean
152.0
7.1
11.8
74.0
Bearish < –1 S.D. From Mean
211.0
7.7
9.9
24.0
Bearish < –2 S.D. From Mean
9.0
-4.3
4.8
44.0
All
1,293.0
8.4
10.2
Based on data from July 24, 1987, to May 2, 2013. Numbers are rounded.

Rotblut observes:

Neither unusual nor extraordinarily high levels of optimism are highly correlated with declining stock prices when the entire survey’s history is considered. The 44 periods with bullish sentiment readings more than two standard deviations above average were followed by a six-month fall in the S&P 500 only 48% of the time. The average six-month decline was 0.7%.

Extraordinarily high levels of pessimism have a mixed record of being correlated with higher stock prices. On a six-month basis, the S&P 500 rose 60% of the time following a bearish sentiment reading more than two standard deviations above the historical mean. The average and median gains were 2.8% and 5.3%, respectively. On a 12-month basis, the S&P 500 rose 60% of the time, with an average gain of 3.1% and a median gain of 14.3%. The average increases in prices are well below the typical increases realized throughout the entire history of the survey, though the median increases are greater than the typical gains.

Read Is the AAII Sentiment Survey a Contrarian Indicator?

Order Quantitative Value from Wiley FinanceAmazon, or Barnes and Noble.

Click here if you’d like to read more on Quantitative Value, or connect with me on LinkedIn.

Read Full Post »

Older Posts »