Feeds:
Posts
Comments

Posts Tagged ‘Mean reversion’

A lesson on the perils of projecting earnings from the Harvard Business Review’s The Daily Stat:

For the past quarter century, equity analysts’ earnings-growth estimates have been almost 100% too high. Their overoptimistic projections have generally ranged from 10% to 12% annually, compared with actual growth of 6% (excluding the spike in growth from 1998–2001), according to McKinsey research. Only in strong-growth years such as 2003 to 2006 did forecasts hit the mark.

As Robert Bruce says (via The Fallible Investor):

Perhaps the most surprising thing to me is the inability of even market professionals to adjust for profit margins. People will talk about how the P/E ratio is reasonable at 19 times without mentioning that it is 19 times the highest profit margins ever recorded. The least we can do, as professionals, is to normalise between economic boom and economic bust, between low profit margins such as those in 1982 when they were ½ normal and very high profit margins such as those of today. A lot of people think profit margins can be sustained. Profit margins are the most mean-reverting series in finance.

For more, see the McKinsey Quarterly’s Equity Analysts: Still too bullish.

Read Full Post »

Recently I’ve been discussing Michael Mauboussin’s December 2007 Mauboussin on Strategy, “Death, Taxes, and Reversion to the Mean; ROIC Patterns: Luck, Persistence, and What to Do About It,” (.pdf) about Mauboussin’s research on the tendency of return on invested capital (ROIC) to revert to the mean (See Part 1 and Part 2).

Mauboussin’s report has significant implications for modelling in general, and also several insights that are particularly useful to Graham net net investors. These implications are as follows:

  • Models are often too optimistic and don’t take into account the “large and robust reference class” about ROIC performance. Mauboussin says:

We know a small subset of companies generate persistently attractive ROICs—levels that cannot be attributed solely to chance—but we are not clear about the underlying causal factors. Our sense is most models assume financial performance that is unduly favorable given the forces of chance and competition.

  • Models often contain errors due to “hidden assumptions.” Mauboussin has identified errors in two distinct areas:

First, analysts frequently project growth, driven by sales and operating profit margins, independent of the investment needs necessary to support that growth. As a result, both incremental and aggregate ROICs are too high. A simple way to check for this error is to add an ROIC line to the model. An appreciation of the degree of serial correlations in ROICs provides perspective on how much ROICs are likely to improve or deteriorate.

The second error is with the continuing, or terminal, value in a discounted cash flow (DCF) model. The continuing value component of a DCF captures the firm’s value for the time beyond the explicit forecast period. Common estimates for continuing value include multiples (often of earnings before interest, taxes, depreciation, and amortization—EBITDA) and growth in perpetuity. In both cases, unpacking the underlying assumptions shows impossibly high future ROICs. 23

  • Models often underestimate the difficulty in sustaining high growth and returns. Few companies sustain rapid growth rates, and predicting which companies will succeed in doing so is very challenging:

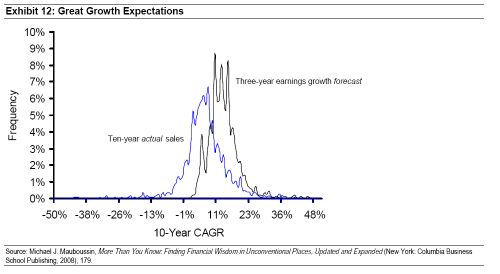
Exhibit 12 illustrates this point. The distribution on the left is the actual 10-year sales growth rate for a large sample of companies with base year revenues of $500 million, which has a mean of about six percent. The distribution on the right is the three-year earnings forecast, which has a 13 percent mean and no negative growth rates. While earnings growth does tend to exceed sales growth by a modest amount over time, these expected growth rates are vastly higher than what is likely to appear. Further, as we saw earlier, there is greater persistence in sales growth rates than in earnings growth rates.

  • Models should be constructed “probabilistically.”

One powerful benefit to the outside view is guidance on how to think about probabilities. The data in Exhibit 5 offer an excellent starting point by showing where companies in each of the ROIC quintiles end up. At the extremes, for instance, we can see it is rare for really bad companies to become really good, or for great companies to plunge to the depths, over a decade.

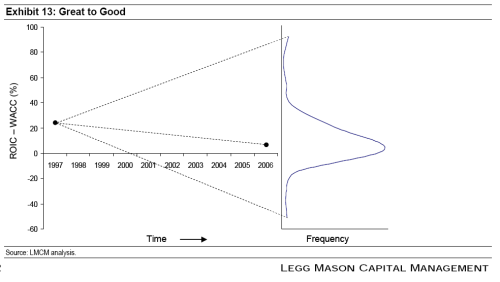
For me, the following Exhibit is the most important chart of the entire paper. It’s Mauboussin’s visualization of the probabilities. He writes:

Assume you randomly draw a company from the highest ROIC quintile in 1997, where the median ROIC less cost of capital spread is in excess of 20 percent. Where will that company end up in a decade? Exhibit 13 shows the picture: while a handful of companies earn higher economic profit spreads in the future, the center of the distribution shifts closer to zero spreads, with a small group slipping to negative.

  • Crucial for net net investors is the need to understand the chances of a turnaround. Mauboussin says the chances are extremely low:

Investors often perceive companies generating subpar ROICs as attractive because of the prospects for unpriced improvements. The challenge to this strategy comes on two fronts. First, research shows low-performing companies get higher premiums than average-performing companies, suggesting the market anticipates change for the better. 24 Second, companies don’t often sustain recoveries.

Defining a sustained recovery as three years of above-cost-of-capital returns following two years of below-cost returns, Credit Suisse research found that only about 30 percent of the sample population was able to engineer a recovery. Roughly one-quarter of the companies produced a non-sustained recovery, and the balance—just under half of the population—either saw no turnaround or disappeared. Exhibit 14 shows these results for nearly 1,200 companies in the technology and retail sectors.


Mauboussin concludes with the important point that the objective of active investors is to “find mispriced securities or situations where the expectations implied by the stock price don’t accurately reflect the fundamental outlook:”

A company with great fundamental performance may earn a market rate of return if the stock price already reflects the fundamentals. You don’t get paid for picking winners; you get paid for unearthing mispricings. Failure to distinguish between fundamentals and expectations is common in the investment business.

Read Full Post »

Yesterday I discussed Michael Mauboussin’s December 2007 Mauboussin on Strategy, “Death, Taxes, and Reversion to the Mean; ROIC Patterns: Luck, Persistence, and What to Do About It,” (.pdf) about Mauboussin’s research on the tendency of return on invested capital (ROIC) to revert to the mean.

Mauboussin’s report has three broad conclusions, with significant implications for modelling:

  • Reversion to the mean is a powerful force. As has been well documented by numerous studies, ROIC reverts to the cost of capital over time. This finding is consistent with microeconomic theory, and is evident in all time periods researchers have studied. However, investors and executives should be careful not to over interpret this result because reversion to the mean is evident in any system with a great deal of randomness. We can explain much of the mean reversion series by recognizing the data are noisy.
  • Persistence does exist. Academic research shows that some companies do generate persistently good, or bad, economic returns. The challenge is finding explanations for that persistence, if they exist.
  • Explaining persistence. It’s not clear that we can explain much persistence beyond chance. But we investigated logical explanatory candidates, including growth, industry representation, and business models. Business model difference appears to be a promising explanatory factor.

How to identify ROIC persistence ex ante

The goal of the investor is to identify businesses with future, sustainable, high ROIC. Mauboussin explores three variables that might be predictive of such persistent high ROIC: corporate growth, the industry in which a company competes, and the company’s business model.

Corporate growth

Mauboussin identifies some correlation between growth and persistence, but cautions:
The bad news about growth, especially for modelers, is it is extremely difficult to forecast. While there is some evidence for sales persistence, the evidence for earnings growth persistence is scant. As some researchers recently summarized, “All in all, the evidence suggests that the odds of an investor successfully uncovering the next stellar growth stock are about the same as correctly calling coin tosses.” 16

Industry

Mauboussin finds that industries that are overrepresented in the highest return quintile throughout the measured period are also overrepresented in the lowest quintile. Those industries include pharmaceuticals/biotechnology and software. He concludes that positive, sustainable ROICs emerge from a good strategic position within a generally favorable industry.

Business model

This is perhaps the most useful and interesting variable considered by Mauboussin. He relates Michael Porter’s two sources of competitive advantage – differentiation and low-cost production – to ROIC by breaking ROIC into its two prime components, net operating profit after tax (NOPAT) margin and invested capital turnover (NOPAT margin equals NOPAT/sales, and invested capital turnover equals sales/invested capital. ROIC is the product of NOPAT margin and invested capital turnover.):

Generally speaking, differentiated companies with a consumer advantage generate attractive returns mostly via high margins and modest invested capital turnover. Consider the successful jewelry store that generates large profits per unit sold (high margins) but doesn’t sell in large volume (low turnover). In contrast, a low-cost company with a production advantage will generate relatively low margins and relatively high invested capital turnover. Think of a classic discount retailer, which doesn’t make much money per unit sold (low margins) but enjoys great inventory velocity (high turnover). Exhibit 8 consolidates these ideas in a simple matrix.

Mauboussin examined the 42 companies that stayed in the first quintile throughout the measured period to see whether they leaned more toward a consumer or production advantage:

Not surprisingly, this group outperformed the broader sample on both NOPAT margin and invested capital turnover, but the impact of margin differential (2.4 times the median) was greater on ROIC than the capital turnover differential (1.9 times). While equivocal, these results suggest the best companies may have a tilt toward consumer advantage.

An analysis of the poor performers reveals that they posted NOPAT margins and invested capital turnover “symmetrical” with the high-performing companies i.e. below the full sample’s median.

Mauboussin concludes:

Our search for factors that may help us anticipate persistently superior performance leaves us little to work with. We do know persistence exists, and that companies that sustain high returns over time start with high returns. Operating in a good industry with above-average growth prospects and some consumer advantage also appears correlated with persistence. Strategy experts Anita McGahan and Michael Porter sum it up: 22

It is impossible to infer the cause of persistence in performance from the fact that persistence occurs. Persistence may be due to fixed resources, consistent industry structure, financial anomalies, price controls, or many other factors that endure . . . In sum, reliable inferences about the cause of persistence cannot be generated from an analysis that only documents whether or not persistence occurred.

More to come.

Read Full Post »

In Michael Mauboussin’s December 2007 Mauboussin on Strategy, “Death, Taxes, and Reversion to the Mean; ROIC Patterns: Luck, Persistence, and What to Do About It,” (.pdf) Mauboussin provides a tour de force of data on the tendency of return on invested capital (ROIC) to revert to the mean. Much of my investing to date has been based on the naive assumption that the tendency is so powerful that companies with a high ROIC should be avoided because the high ROIC is not sustainable, but rather indicates a cyclical top in margins and earnings. This view is broadly supported by other research on mean reversion in earnings that I have discussed in the past, which has suggested, somewhat counter-intuitively, that in aggregate the earnings of low price-to-book value stocks grow faster than the earnings of high price-to-book value stocks. I usually cite this table from the Tweedy Browne What works in investing document:

tweedy-table-3

In the four years after the date of selection, the earnings of the companies in the lowest price-to-book value quintile (average price-to-book value of 0.36) increase 24.4%, more than the companies in the highest price-to-book value quintile (average price-to-book value of 3.42), whose earnings increased only 8.2%. DeBondt and Thaler attribute the earnings outperformance of the companies in the lowest quintile to mean reversion, which Tweedy Browne described as the observation that “significant declines in earnings are followed by significant earnings increases, and that significant earnings increases are followed by slower rates of increase or declines.”

Mauboussin’s research seems to suggest that, while there exists a strong tendency towards mean reversion, some companies do “post persistently high or low returns beyond what chance dictates.” He has two caveats for those seeking the stocks with persistent high returns:

1. The “ROIC data incorporate much more randomness than most analysts realize.”

2. He “had little luck in identifying the factors behind sustainably high returns.”

That said, Mauboussin presents some striking data about “persistence” in high ROIC companies that suggests investing in high ROIC companies is not necessarily a short ride to the poor house, and might actually work as an investment strategy. (That was very difficult to write. It goes against every fiber of my being.) Here’s Mauboussin’s research:

Mauboussin’s report has three broad conclusions, with significant implications for modelling:

  • Reversion to the mean is a powerful force. As has been well documented by numerous studies, ROIC reverts to the cost of capital over time. This finding is consistent with microeconomic theory, and is evident in all time periods researchers have studied. However, investors and executives should be careful not to over interpret this result because reversion to the mean is evident in any system with a great deal of randomness. We can explain much of the mean reversion series by recognizing the data are noisy.
  • Persistence does exist. Academic research shows that some companies do generate persistently good, or bad, economic returns. The challenge is finding explanations for that persistence, if they exist.
  • Explaining persistence. It’s not clear that we can explain much persistence beyond chance. But we investigated logical explanatory candidates, including growth, industry  representation, and business models. Business model difference appears to be a promising explanatory factor.

ROIC mean reversion

Here Mauboussin charts the reversion-to-the-mean phenomenon using data from “1000 non-financial companies from 1997 to 2006.” The chart shows a clear trend towards nil economic profit, as you would expect:

We start by ranking companies into quintiles based on their 1997 ROIC. We then follow the median ROIC for the five cohorts through 2006. While all of the returns do not settle at the cost of capital (roughly eight percent) in 2006, they clearly migrate toward that level.

And another chart showing the change:

Mauboussin has this elegant interpretation of the results:

Any system that combines skill and luck will exhibit mean reversion over time. 7 Francis Galton demonstrated this point in his 1889 book, Natural Inheritance, using the heights of adults. 8 Galton showed, for example, that children of tall parents have a tendency to be tall, but are often not as tall as their parents. Likewise, children of short parents tend to be short, but not as short as their parents. Heredity plays a role, but over time adult heights revert to the mean.

The basic idea is outstanding performance combines strong skill and good luck. Abysmal performance, in contrast, reflects weak skill and bad luck. Even if skill persists in subsequent periods, luck evens out across the participants, pushing results closer to average. So it’s not that the standard deviation of the whole sample is shrinking; rather, luck’s role diminishes over time.

Separating the relative contributions of skill and luck is no easy task. Naturally, sample size is crucial because skill only surfaces with a large number of observations. For example, statistician Jim Albert estimates that a baseball player’s batting average over a full season is a fifty-fifty combination between skill and luck. Batting averages for 100 at-bats, in contrast, are 80 percent luck. 9

Persistence in ROIC Data

“Persistence” is the likelihood a company will sustain its ROIC. If the stocks are ranked on the basis of ROIC and then placed into quintiles, persistence is likliehood that a stock will remain in the same quintile throughout the measured time frame. Mauboussin then measures persistence by analysing “quintile migration:”

This exhibit shows where companies starting in one quintile (the vertical axis) ended up after nine years (the horizontal axis). Most of the percentages in the exhibit are unremarkable, but two stand out. First, a full 41 percent of the companies that started in the top quintile were there nine years later, while 39 percent of the companies in the cellar-dweller quintile ended up there. Independent studies of this persistence reveal a similar pattern. So it appears there is persistence with some subset of the best and worst companies. Academic research confirms that some companies do show persistent results. Studies also show that companies rarely go from very high to very low performance or vice versa. 13

These are striking findings. In Mauboussin’s data, there was a 64% chance that a company in the highest quintile at the start of the period was still in the first or second quintile at the end of the 10 year period. Further, it seems that there is a three-in-four chance that the high quintile stocks don’t fall into the lowest or second lowest quintiles after 10 years. It’s not all good news however.

Before going too far with this result, we need to consider two issues. First, this persistence analysis solely looks at where companies start and finish, without asking what happens in between. As it turns out, there is a lot of action in the intervening years. For example, less than half of the 41 percent of the companies that start and end in the first quintile stay in the quintile the whole time. This means that less than four percent of the total-company sample remains in the highest quintile of ROIC for the full nine years.

The second issue is serial correlation, the probability a company stays in the same ROIC quintile from year to year. As Exhibit 5 suggests, the highest serial correlations (over 80 percent) are in Q1 and Q5. The middle quintile, Q3, has the lowest correlation of roughly 60 percent, while Q2 and Q4 are similar at about 70 percent.

This result may seem counterintuitive at first, as it suggests results for really good and really bad companies (Q1 and Q5) are more likely to persist than for average companies (Q2, Q3, and Q4). But this outcome is a product of the methodology: since each year’s sample is broken into quintiles, and the sample is roughly normally distributed, the ROIC ranges are much narrower for the middle three quintiles than for the extreme quintiles. So, for instance, a small change in ROIC level can move a Q3 company into a neighboring quintile, whereas a larger absolute change is necessary to shift a Q1 and Q5 company. Having some sense of serial correlations by quintile, however, provides useful perspective for investors building company models.

So, in summary, better performed companies remain in the higher ROIC quintiles over time, although the better-performed quintiles will still suffer substantial ROIC attrition over time.

More to come.

Hat tip Fallible Investor.

Read Full Post »

Mean reversion is a favorite investment topic here on Greenbackd (see, for example, my posts on Mean reversion in earnings, Contrarian value investment and Lakonishok, Shleifer, and Vishny’s Contrarian Investment, Extrapolation, and Risk).

The premise of contrarianism is mean reversion, which is the idea that stocks that have performed poorly in the past will perform better in the future and stocks that have performed well in the past will not perform as well. Benjamin Graham, quoting Horace’s Ars Poetica, described it thus:

Many shall be restored that now are fallen and many shall fall that are now in honor.

LSV argue in their paper that most investors don’t fully appreciate the phenomenon, which leads them to extrapolate past performance too far into the future. In practical terms it means the contrarian investor profits from other investors’ incorrect assessment that stocks that have performed well in the past will perform well in the future and stocks that have performed poorly in the past will continue to perform poorly.

The outstanding Shadowstock blog has identified five “strong candidates for mean reversion.” To see John’s Shadowstock.com analysis, click here.

Read Full Post »

One of the most fascinating examples of the phenomenon of mean reversion was identified by Werner F.M. DeBondt and Richard H. Thaler in Further Evidence on Investor Overreaction and Stock Market Seasonality. DeBondt and Thaler examined the relative performance of quintiles of stocks on the NYSE and AMEX ranked according to book value. As an adjunct to the main study, one of the variables they analyzed was the relative earnings performance of stocks in the lowest and highest price-to-book quintiles.

DeBondt and Thaler’s findings are as interesting as they are counter-intuitive. Stocks in the lowest price-to-book quintile (the cheapest stocks) grew their earnings faster than the stocks in the highest price-to-book quintile (the most expensive stocks). Tweedy Browne set out DeBondt and Thaler’s findings in Table 3 below, which describes the average earnings per share for companies in the lowest and highest quintile of price-to-book value in the three years prior to selection and the four years subsequent to selection:

tweedy-table-3

In the four years after the date of selection, the earnings of the companies in the lowest price-to-book value quintile (average price-to-book value of 0.36) increase 24.4%, more than the companies in the highest price-to-book value quintile (average price-to-book value of 3.42), whose earnings increased only 8.2%. DeBondt and Thaler attribute the earnings outperformance of the companies in the lowest quintile to mean reversion, which Tweedy Browne described as the observation that “significant declines in earnings are followed by significant earnings increases, and that significant earnings increases are followed by slower rates of increase or declines.”

The implication here is that not only does the price of stocks that are cheap relative to other stocks regress to the mean, but the underlying performance does too. That’s an amazing finding. There’s really no good reason why low price-to-book should be such a good predictor for short and mid-term earnings growth. I’ve spent some time thinking about why this might be so, and the only possible explanation I can come up with is magic. Nothing else fits.

Read Full Post »