Recently I’ve been discussing Michael Mauboussin’s December 2007 Mauboussin on Strategy, “Death, Taxes, and Reversion to the Mean; ROIC Patterns: Luck, Persistence, and What to Do About It,” (.pdf) about Mauboussin’s research on the tendency of return on invested capital (ROIC) to revert to the mean (See Part 1 and Part 2).
Mauboussin’s report has significant implications for modelling in general, and also several insights that are particularly useful to Graham net net investors. These implications are as follows:
- Models are often too optimistic and don’t take into account the “large and robust reference class” about ROIC performance. Mauboussin says:
We know a small subset of companies generate persistently attractive ROICs—levels that cannot be attributed solely to chance—but we are not clear about the underlying causal factors. Our sense is most models assume financial performance that is unduly favorable given the forces of chance and competition.
- Models often contain errors due to “hidden assumptions.” Mauboussin has identified errors in two distinct areas:
First, analysts frequently project growth, driven by sales and operating profit margins, independent of the investment needs necessary to support that growth. As a result, both incremental and aggregate ROICs are too high. A simple way to check for this error is to add an ROIC line to the model. An appreciation of the degree of serial correlations in ROICs provides perspective on how much ROICs are likely to improve or deteriorate.
The second error is with the continuing, or terminal, value in a discounted cash flow (DCF) model. The continuing value component of a DCF captures the firm’s value for the time beyond the explicit forecast period. Common estimates for continuing value include multiples (often of earnings before interest, taxes, depreciation, and amortization—EBITDA) and growth in perpetuity. In both cases, unpacking the underlying assumptions shows impossibly high future ROICs. 23
- Models often underestimate the difficulty in sustaining high growth and returns. Few companies sustain rapid growth rates, and predicting which companies will succeed in doing so is very challenging:
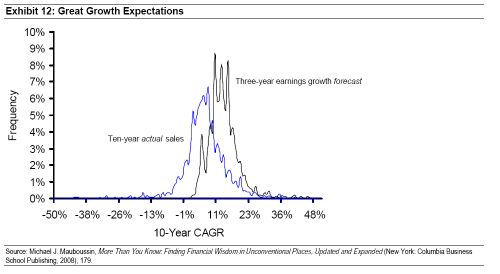
Exhibit 12 illustrates this point. The distribution on the left is the actual 10-year sales growth rate for a large sample of companies with base year revenues of $500 million, which has a mean of about six percent. The distribution on the right is the three-year earnings forecast, which has a 13 percent mean and no negative growth rates. While earnings growth does tend to exceed sales growth by a modest amount over time, these expected growth rates are vastly higher than what is likely to appear. Further, as we saw earlier, there is greater persistence in sales growth rates than in earnings growth rates.
- Models should be constructed “probabilistically.”
One powerful benefit to the outside view is guidance on how to think about probabilities. The data in Exhibit 5 offer an excellent starting point by showing where companies in each of the ROIC quintiles end up. At the extremes, for instance, we can see it is rare for really bad companies to become really good, or for great companies to plunge to the depths, over a decade.
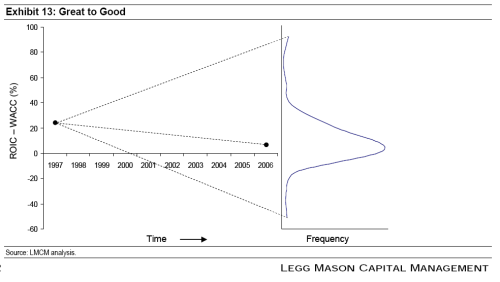
For me, the following Exhibit is the most important chart of the entire paper. It’s Mauboussin’s visualization of the probabilities. He writes:
Assume you randomly draw a company from the highest ROIC quintile in 1997, where the median ROIC less cost of capital spread is in excess of 20 percent. Where will that company end up in a decade? Exhibit 13 shows the picture: while a handful of companies earn higher economic profit spreads in the future, the center of the distribution shifts closer to zero spreads, with a small group slipping to negative.
- Crucial for net net investors is the need to understand the chances of a turnaround. Mauboussin says the chances are extremely low:
Investors often perceive companies generating subpar ROICs as attractive because of the prospects for unpriced improvements. The challenge to this strategy comes on two fronts. First, research shows low-performing companies get higher premiums than average-performing companies, suggesting the market anticipates change for the better. 24 Second, companies don’t often sustain recoveries.
Defining a sustained recovery as three years of above-cost-of-capital returns following two years of below-cost returns, Credit Suisse research found that only about 30 percent of the sample population was able to engineer a recovery. Roughly one-quarter of the companies produced a non-sustained recovery, and the balance—just under half of the population—either saw no turnaround or disappeared. Exhibit 14 shows these results for nearly 1,200 companies in the technology and retail sectors.
Mauboussin concludes with the important point that the objective of active investors is to “find mispriced securities or situations where the expectations implied by the stock price don’t accurately reflect the fundamental outlook:”
A company with great fundamental performance may earn a market rate of return if the stock price already reflects the fundamentals. You don’t get paid for picking winners; you get paid for unearthing mispricings. Failure to distinguish between fundamentals and expectations is common in the investment business.


Leave a comment