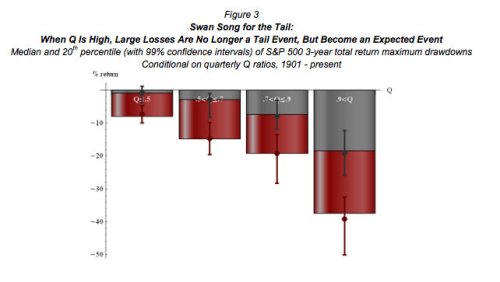
Universa Chief Investment Officer Mark Spitznagel’s June 2011 working paper The Dao of Corporate Finance, Q Ratios, and Stock Market Crashes (.pdf), and the May 2012 update The Austrians and the Swan: Birds of a Different Feather (.pdf) examine the “clear and rigorous evidence of a direct relationship“ between overvaluation measured by the equity q ratio and “subsequent extreme losses in the stock market.”
Spitznagel argues that at valuations where the equity q ratio exceeds 0.9 a 110-year relationship points to an “expected (median) drawdown of 20%, and a 20% chance of a larger than 40% correction in the S&P500 within the next few years; these probabilities continually reset as valuations remain elevated, making an eventual deep drawdown from current levels highly likely.”
Today I examine the calculation of the equity q ratio and estimated market-level returns. Later this week I’ll take a look at the likelihood of massive drawdowns at elevated q ratios.
Spitznagel is perhaps best known to we folk who do not trade volatility as Nassim Taleb’s chief trader at Taleb’s Empirica. Here’s Malcolm Gladwell describing Spitznagel in his New Yorker article Blowing Up:
Taleb was up at a whiteboard by the door, his marker squeaking furiously as he scribbled possible solutions. Spitznagel and Pallop looked on intently. Spitznagel is blond and from the Midwest and does yoga: in contrast to Taleb, he exudes a certain laconic levelheadedness. In a bar, Taleb would pick a fight. Spitznagel would break it up.
…
The three argued back and forth about the solution. It appeared that Taleb might be wrong, but before the matter could be resolved the markets opened. Taleb returned to his desk and began to bicker with Spitznagel about what exactly would be put on the company boom box. Spitznagel plays the piano and the French horn and has appointed himself the Empirica d.j. He wanted to play Mahler, and Taleb does not like Mahler. “Mahler is not good for volatility,” Taleb complained. “Bach is good. St. Matthew’s Passion!” Taleb gestured toward Spitznagel, who was wearing a gray woollen turtleneck. “Look at him. He wants to be like von Karajan, like someone who wants to live in a castle. Technically superior to the rest of us. No chitchatting. Top skier. That’s Mark!”
In his 2011 and 2012 papers, Spitznagel describes the equity q ratio as the “most robust aggregate overvaluation metric, which isolates the key drivers of valuation.”
The “equity” q ratio is similar to Tobin’s q ratio, which is the ratio of enterprise value (market capitalization plus debt) to corporate assets or invested capital. With no debt, Tobin’s q is market capitalization over total assets. The equity q ratio (or “Q ratio”, as Spitznagel describes it in his papers) is market capitalization over shareholders’ equity. Shareholders equity is total assets less total debt. With no debt, shareholders’ equity is equal to invested capital. The equity q ratio is a market level price-to-shareholders’ equity ratio, where shareholders’ equity is calculated using assets valued at replacement cost.
Spitznagel examines the long-run tendency of the equity q ratio to mean revert, noting:
[T]he arithmetic mean to which it has been seemingly attracted is, surprisingly, not 1, but rather about .7. This, then, would be the appropriate “fair value” for use in gauging over- or under-valuation (and the March 2009 low actually came very close to this mean).

Why doesn’t equity q mean revert to 1?
It would have been expected for this Q ratio level to be where ROIC = WACC, that is, where the price equals the net worth of the businesses, Q=1. Ostensibly, the current value of invested capital (i.e., the replacement cost of company assets) has been systematically overstated (and its depreciation understated). This is evident in the historical aggregate ROIC as computed from Flow of Funds data vis-à-vis the actual known aggregate ROIC (and adjusting thereto is consistent with Q ≈ 1).
Is the equity q ratio predictive?
If the Q ratio … is in fact the most robust and rigorous metric of aggregate stock market valuation and represents all there is to know about aggregate stock market valuation, shouldn’t it be the case that it has empirical validity as well? That is, shouldn’t it tell you something ex ante about subsequent aggregate equity returns? (The caveat of course, from Williams, is that, since “the public is more emotional than logical, it is foolish to expect a relentless convergence of market price toward investment value.“)
Just a casual perusal of Figure 2 [above] (and a basic memory of what U.S. stocks did during this period) tells the story quite well, but let’s put some numbers on it.
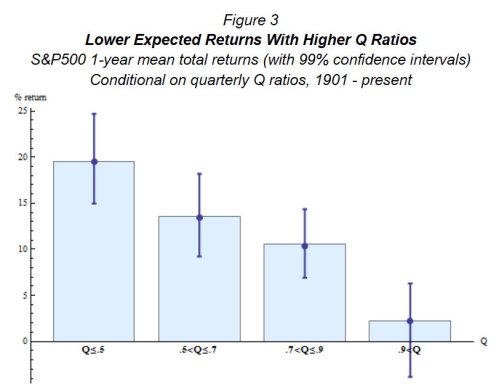
Figure 3 from the 2011 paper shows Spitznagel’s backtest of the relationship between mean one-year S&P 500 total returns and the starting level of the equity q ratio going back to 1901:

Spitzagel notes:
When stocks are overvalued on aggregate, as identified by the Q ratio, their returns have been lower (with 99% confidence) than when they are less overvalued, not to mention undervalued. (Whenever one hears a reference to historical aggregate stock returns to support forecasts of future returns, it is good to recall that not all historical returns were created equal.)
Spitznagel’s white papers are important because they demonstrate that, like the Shiller PE and Buffett’s total market capitalization-to-gross national product measure, the equity q ratio is a highly predictive measure of subsequent stock market performance. Spitznagel is a specialist in tail risk, and so the most intriguing part of Spitznagel’s papers is his demonstration of the utility of the equity q ratio in identifying “susceptibility to shifts from any extreme consensus” because “such shifts of extreme consensus are naturally among the predominant mechanics of stock market crashes.” I’ll continue with the rest of the paper later this week.
Buy my book The Acquirer’s Multiple: How the Billionaire Contrarians of Deep Value Beat the Market from on Kindle, paperback, and Audible.
Here’s your book for the fall if you’re on global Wall Street. Tobias Carlisle has hit a home run deep over left field. It’s an incredibly smart, dense, 213 pages on how to not lose money in the market. It’s your Autumn smart read. –Tom Keene, Bloomberg’s Editor-At-Large, Bloomberg Surveillance, September 9, 2014.
Click here if you’d like to read more on The Acquirer’s Multiple, or connect with me on Twitter, LinkedIn or Facebook. Check out the best deep value stocks in the largest 1000 names for free on the deep value stock screener at The Acquirer’s Multiple®.
Read Full Post »


