Feeds:
Posts
Comments

Posts Tagged ‘Stocks’

Since Joel Greenblatt’s introduction of the Magic Formula in the 2006 book “The Little Book That Beats The Market,” researchers have conducted a number of studies on the strategy and found it to be a market beater, both domestically and abroad.

Greenblatt claims returns in the order of 30.8 percent per year against a market average of 12.3 percent, and S&P500 return of 12.4 percent per year:

In Does Joel Greenblatt’s Magic Formula Investing Have Any Alpha? Meena Krishnamsetty finds that the Magic Formula generates annual alpha 4.5 percent:

It doesn’t beat the index funds by 18% per year and generate Warren Buffett like returns, but the excess return is still more than 5% per year. This is better than Eugene Fama’s DFA Small Cap Value Fund. It is also better than Lakonishok’s LSV Value Equity Fund.

Wes Gray’s Empirical Finance Blog struggles to repeat the study:

[We] can’t replicate the results under a variety of methods.

We’ve hacked and slashed the data, dealt with survivor bias, point-in-time bias, erroneous data, and all the other standard techniques used in academic empirical asset pricing analysis–still no dice.

In the preliminary results presented below, we analyze a stock universe consisting of large-caps (defined as being larger than 80 percentile on the NYSE in a given year). We test a portfolio that is annually rebalanced on June 30th, equal-weight invested across 30 stocks on July 1st, and held until June 30th of the following year.

Wes finds “serious outperformance” but “nowhere near the 31% CAGR outlined in the book.

Wes thinks that the outperformance of the Magic Formula is due to small cap stocks, which he tests in a second post “Magic Formula and Small Caps–The Missing Link?

Here are Wes’s results:

[While] the MF returns are definitely higher when you allow for smaller stocks, the results still do not earn anywhere near 31% CAGR.

Some closer observations of our results versus the results from the book:

For major “up” years, it seems that our backtest of the magic formula are very similar (especially from a statistical standpoint where the portfolios only have 30 names): 1991, 1995, 1997, 1999, 2001, and 2003.

The BIG difference is during down years: 1990, 1994, 2000, and 2002. For some reason, our backtest shows results which are roughly in line with the R2K (Russell 2000), but the MF results from the book present compelling upside returns during market downturns–so somehow the book results have negative beta during market blowouts? Weird to say the least…

James Montier, in a 2006 paper, “The Little Note That Beats the Markets” says that it works globally:

The results of our backtest suggest that Greenblatt’s strategy isn’t unique to the US. We tested the Little Book strategy on US, European, UK and Japanese markets between 1993 and 2005. The results are impressive. The Little Book strategy beat the market (an equally weighted stock index) by 3.6%, 8.8%, 7.3% and 10.8% in the various regions respectively. And in all cases with lower volatility than the market! The outperformance was even better against the cap weighted indices.

So the Magic Formula generates alpha, and beats the market globally, but not by as much as Greenblatt found originally, and much of the outperformance may be due to small cap stocks.

The Magic Formula and EBIT/TEV

Last week I took a look at the Loughran Wellman and Gray Vogel papers that found the enterprise multiple,  EBITDA/enterprise value, to be the best performing price ratio. A footnote in the Gray and Vogel paper says that they conducted the same research substituting EBIT for EBITDA and found “nearly identical results,” which is perhaps a little surprising but not inconceivable because they are so similar.

EBIT/TEV is one of two components in the Magic Formula (the other being ROC). I have long believed that the quality metric (ROC) adds little to the performance of the value metric (EBIT/EV), and that much of the success of the Magic Formula is due to its use of the enterprise multiple. James Montier seems to agree. In 2006, Montier backtested the strategy and its components in the US, Europe ex UK, UK and Japan:

The universe utilised was a combination of the FTSE and MSCI indices. This gave us the largest sample of data. We analysed the data from 1993 until the end of 2005. All returns and prices were measured in dollars. Utilities and Financials were both excluded from the test, for reasons that will become obvious very shortly. We only rebalance yearly.

Here are the results of Montier’s backtest of the Magic Formula:

And here’re the results for EBIT/TEV over the same period:

Huh? EBIT/TEV alone outperforms the Magic Formula everywhere but Japan?

Montier says that return on capital seems to bring little to the party in the UK and the USA:

In all the regions except Japan, the returns are higher from simply using a pure [EBIT/TEV] filter than they are from using the Little Book strategy. In the US and the UK, the gains from a pure [EBIT/TEV] strategy are very sizeable. In Europe, a pure [EBIT/TEV] strategy doesn’t alter the results from the Little Book strategy very much, but it is more volatile than the Little Book strategy. In Japan, the returns are lower than the Little Book strategy, but so is the relative volatility.

Montier suggests that one reason for favoring the Magic Formula over “pure” EBIT/TEV is career defence. The backtest covers an unusual period in the markets when expensive stocks outperformed for an extended period of time.

The charts below suggest a reason why one might want to have some form of quality input into the basic value screen. The first chart shows the top and bottom ranked deciles by EBIT/EV for the US (although other countries tell a similar story). It clearly shows the impact of the bubble. For a number of years, during the bubble, stocks that were simply cheap were shunned as we all know.


However, the chart below shows the top and bottom deciles using the combined Little Book strategy again for the US. The bubble is again visible, but the ROC component of the screen prevented the massive underperformance that was seen with the pure value strategy. Of course, the resulting returns are lower, but a fund manager following this strategy is unlikely to have lost his job.

In the second chart, note that it took eight years for the value decile to catch up to the glamour decile. They were tough times for value investors.

Conclusion

The Magic Formula beats the market, and generates real alpha. It might not beat the market by as much as Greenblatt found originally, and much of the outperformance is due to small cap stocks, but it’s a useful strategy. Better performance may be found in the use of pure EBIT/EV, but investors employing such a strategy could have very long periods of lean years.

Buy my book The Acquirer’s Multiple: How the Billionaire Contrarians of Deep Value Beat the Market from on Kindlepaperback, and Audible.

Here’s your book for the fall if you’re on global Wall Street. Tobias Carlisle has hit a home run deep over left field. It’s an incredibly smart, dense, 213 pages on how to not lose money in the market. It’s your Autumn smart read. –Tom Keene, Bloomberg’s Editor-At-Large, Bloomberg Surveillance, September 9, 2014.

Click here if you’d like to read more on The Acquirer’s Multiple, or connect with me on Twitter, LinkedIn or Facebook. Check out the best deep value stocks in the largest 1000 names for free on the deep value stock screener at The Acquirer’s Multiple®.


Read Full Post »

In their March 2012 paper, “Analyzing Valuation Measures: A Performance Horse-Race over the past 40 Years,” Wes Gray and Jack Vogel asked, “Do long-term, normalized price ratios outperform single-year price ratios?

Benjamin Graham promoted the use of long-term, “normalized” price ratios over single-year price ratios. Graham suggested in Security Analysis that “[earnings in P/E] should cover a period of not less than five years, and preferably seven to ten years.

Robert Shiller has also advocated for long-term price ratios because “annual earnings are noisy as a measure of fundamental value.” A study in the UK by Anderson and Brooks [2006] found that a long-term average (eight-years) of earnings increased the value premium (i.e. the spread in returns between value and growth stocks) by 6 percent over one-year earnings.

Gray and Vogel test a range of year averages for all the price ratios from yesterday’s post. The results are presented below. Equal-weight first:

Market capitalization-weight:

Commentary

We can make several observations about the long-term averages. First, there is no evidence that any long-term average is consistently better than any other, measured either on the raw performance to the value decile, or by the value premium created. This is true for both equal-weight portfolios and market capitalization-weighted portfolios, which we would expect. For example, in the equal-weight table, the E/M value portfolio generates its best return using a 4-year average, but the spread is biggest using the 3-year average. Compare this with EBITDA/TEV, which generates its best return using a single-year ratio, and its biggest spread using a 3-year average, or FCF/TEV, which generates both its best return and biggest spread with a single-year average. There is no consistency, or pattern to the results that we can detect. If anything, the results appear random to me, which leads me to conclude that there’s no evidence that long-term averages outperform single-year price ratios.

We can make other, perhaps more positive observations. For example, in the equal-weight panel, the enterprise multiple is consistently the best performing price ratio across most averages (although it seems to get headed by GP/TEV near the 7-year and 8-year averages). It also generates the biggest value premium across all long-term averages.  It’s also a stand-out performer in the market capitalization-weighted panel, delivering the second best returns to GP/TEV, but generating a bigger value premium than GP/TEV about half the time.

The final observation that we can make is that the value portfolio consistently outperforms the “growth” or expensive portfolio. For every price ratio, and over every long-term average, the better returns were found in the value portfolio. Value works.

Conclusion

While long-term average price ratios have been promoted by giants of the investment world like Graham and Shiller as being better than single-year ratios, there exists scant evidence that this is true. A single UK study found a significant premium for long-term average price ratios, but Gray and Vogel’s results do not support the findings of that study. There is no evidence in Gray and Vogel’s results that any long-term average is better than any other, or better than a single-year price ratio. One heartening observation is that, however we slice it, value outperforms glamour. Whichever price ratio we choose to examine, over any long-term average, value is the better bet.

Read Full Post »

Friends, Romans, countrymen, lend me your ears;
I come to bury Caesar, not to praise him.

Having just anointed the enterprise multiple as king yesterday, I’m prepared to bury it in a shallow grave today if I can get a little more performance. Fickle.

In their very recent paper, “Analyzing Valuation Measures: A Performance Horse-Race over the past 40 Years,” Wes Gray and Jack Vogel asked, “Which valuation metric has historically performed the best?

Gray and Vogel examine a range of price ratios over the period 1971 to 2010:

  • Earnings to Market Capitalization (E/M)
  • Earnings before interest and taxes and depreciation and amortization to total
  • enterprise value (EBITDA/TEV)
  • Free cash flow to total enterprise value (FCF/TEV)
  • Gross profits to total enterprise value (GP/TEV)
  • Book to market (B/M)
  • Forward Earnings Estimates to Market Capitalization (FE/M)

They find that the enterprise multiple is the best performing price ratio:

The returns to an annually rebalanced equal-weight portfolio of high EBITDA/TEV stocks, earn 17.66% a year, with a 2.91% annual 3-factor alpha (stocks below the 10% NYSE market equity breakpoint are eliminated). This compares favorably to a practitioner favorite, E/M (i.e., inverted Price-to-earnings, or P/E). Cheap E/M stocks earn 15.23% a year, but show no evidence of alpha after controlling for market, size, and value exposures. The academic favorite, book-to-market (B/M), tells a similar story as E/M and earns 15.03% for the cheapest stocks, but with no alpha. FE/M is the worst performing metric by a wide margin, suggesting that investors shy away from using analyst earnings estimates to make investment decisions.

The also find that the enterprise multiple generates the biggest value premium:

We find other interesting facts about valuation metrics. When we analyze the spread in returns between the cheapest and most expensive stocks, given a specific valuation measure, we again find that EBITDA/TEV is the most effective measure. The lowest quintile returns based on EBITDA/TEV return 7.97% a year versus the 17.66% for the cheapest stocks—a spread of 9.69%. This compares very favorably to the spread created by E/M, which is only 5.82% (9.41% for the expensive quintile and 15.23% for the cheap quintile).

Here are the results for all the price ratios (click to make it bigger):

Which price ratio outperforms the enterprise multiple? None. Vivat rex.

Read Full Post »

Aswath Damodaran, in his excellent paper “Value Investing: Investing for Grown Ups?”, asks whether spending time researching a company’s fundamentals (“active” investing) generates a higher return for investors than a comparable value-based index (“passive” investing)?

Says Damodaran:

Of all of the investment philosophies, value investing comes with the most impressive research backing from both academica and practitioners. The excess returns earned by stocks that fit value criteria (low multiples of earnings and book value, high dividends) and the success of some high-profile value investors (such as Warren Buffett) draws investors into the active value investing fold.

But does spending time researching a company’s fundamentals generate higher returns for investors than a passive index?  Does active value investing pay off?

A simple test of the returns to the active component of value investing is to look at the returns earned by active value investors, relative to a passive value investment option, and compare these excess returns with those generated by active growth investors, relative to a passive growth investment alternative. In figure 17, we compute the excess returns generated for all US mutual funds, classifed into value, blend and growth categories, relative to index funds for each category. Thus, the value mutual funds are compared to index fund of just value stocks (low price to book and low price to earnings stocks) and the growth mutual funds to a growth index fund (high price to book and high price earnings stocks).

Shocker! Active value investing mutual fund managers would be better off buying the index.

The results are not good for value investing. The only funds that beat their index counterparts are growth funds, and they do so in all three market cap classes. Active value investing funds generally do the worst of any group of funds and particularly so with large market cap companies.

Damodaran has a great conclusion:

If you are an individual value investors, you can attribute this poor performance to the pressures that mutual funds managers operate under, to deliver results quickly, an expectation that may be at odds with classic value investing. That may be the case, but it points to the need for discipline and consistency in value investing and to the very real fact that beating the market is always difficult to do, even for a good value investor.

Read Full Post »

This week I’ve been taking a look at Aswath Damodaran’s paper “Value Investing: Investing for Grown Ups?” in which he asks, “If value investing works, why do value investors underperform?”

Damodaran divides the value world into three groups:

  1. The Passive Screeners,” – “The Graham approach to value investing is a screening approach, where investors adhere to strict screens… and pick stocks that pass those screens.”
  2. The Contrarian Value Investors,” – “In this manifestation of value investing, you begin with the belief that stocks that are beaten down because of the perception that they are poor investments (because of poor investments, default risk or bad management) tend to get punished too much by markets just as stocks that are viewed as good investments get pushed up too much.”
  3. Activist value investors,” – “The strategies used by …[activist value investors] are diverse, and will reflect why the firm is undervalued in the first place. If a business has investments in poor performing assets or businesses, shutting down, divesting or spinning off these assets will create value for its investors. When a firm is being far too conservative in its use of debt, you may push for a recapitalization (where the firm borrows money and buys back stock). Investing in a firm that could be worth more to someone else because of synergy, you may push for it to become the target of an acquisition. When a company’s value is weighed down because it is perceived as having too much cash, you may demand higher dividends or stock buybacks. In each of these scenarios, you may have to confront incumbent managers who are reluctant to make these changes. In fact, if your concerns are broadly about management competence, you may even push for a change in the top management of the firm.”

We looked at Damodaran’s passive screeners Tuesday, the contrarian value investors Wednesday, and today we’ll take a look at the activists.

The Activist Value Investors

Damodaran cites the well-known Brav, Jiang and Kim article that I have discussed here before:

If activist investors hope to generate their returns from changing the way companies are run, they should target poorly managed companies for their campaigns. Institutional and individual activists do seem to focus on poorly managed companies, targeting companies that are less profitable and have delivered lower returns than their peer group. Hedge fund activists seem to focus their attention on a different group. A study of 888 campaigns mounted by activist hedge funds between 2001 and 2005 finds that the typical target companies are small to mid cap companies, have above average market liquidity, trade at low price to book value ratios, are profitable with solid cash flows and pay their CEOs more than other companies in their peer group. Thus, they are more likely to be under valued companies than poorly managed. A paper that examines hedge fund motives behind the targeting provides more backing for this general proposition in figure 15.

As we have seen both undervalued or poorly managed stocks can generate good returns.

Damodaran says that the “market reaction to activist investors, whether they are hedge funds or individuals, is positive.” A study that looked at stock returns in targeted companies in the days around the announcement of activism showed the following results:

Damodaran points out that “the bulk of the excess return (about 5% of the total of 7%) is earned in the twenty days before the announcement and that the post-announcement drift is small.”

There is also a jump in trading volume prior to the announcement, which does interesting (and troubling) questions about trading being done before the announcements. The study also documents that the average returns around activism announcement has been drifting down over time, from 14% in 2001 to less than 4% in 2007.

Can you make money following activist investors?

Damodaran says “sort of,” if you follow:

The right activists: If the median activist hedge fund investor essentially breaks even, as the evidence suggests, a blunderbuss approach of investing in a company targeted by any activist investor is unlikely to generate value. However, if you are selective about the activist investors you follow, targeting only the most effective, and investing only in companies that they target, your odds improve.

Performance cues: To the extent that the excess returns from this strategy come from changes made at the firm to operations, capital structure, dividend policy and/or corporate governance, you should keep an eye on whether and how much change you see on each of these dimesions at the targeted firms. If the managers at these firms are able to stonewall activist investors successfully , the returns are likely to be unimpressive as well.

A hostile acquisition windfall? A study by Greenwood and Schor notes that while a strategy of buying stocks that have been targeted by activist investors generates  excess returns, almost all of those returns can be attributed to the subset of these firms that get taken over in hostile acquisitons.

Follow the right activists, and do ok, or front run them, and potentially do very well:

There is an alternate strategy worth considering, that may offer higher returns, that also draws on activist investing. You can try to identify companies that are poorly managed and run, and thus most likely to be targeted by activist investors. In effect, you are screening firms for low returns on capital, low debt ratios and large cash balances, representing screens for potential value enhancement, and ageing CEOs, corporate scandals and/or shifts in voting rights operating as screens for the management change. If you succeed, you should be able to generate higher returns when some of these firms change, either because of pressure from within (from an insider or an assertive board of directors) or from without (activist investors or a hostile acquisition).

So how do we mess it up?

• This power of activist value investing usually comes from having the capital to buy significant stakes in poorly managed firms and using these large stockholder positions to induce management to change their behavior. Managers are unlikely to listen to small stockholders, no matter how persuasive their case may be.

• In addition to capital, though, activist value investors need to be willing to spend substantial time fighting to make themselves heard and in pushing for change. This investment in time and resources implies that an activist value investor has to pick relatively few fights and be willing to invest substantially in each fight.

• Activist value investing, by its very nature, requires a thorough understanding of target firms, since you have to know where each of these firms is failing and how you would fix these problems. Not surprisingly, activist value investors tend to choose a sector that they know really well and take positions in firms within that sector. It is clearly not a strategy that will lead to a well diversified portfolio.

• Finally, activist value investing is not for the faint hearted. Incumbent managers are unlikely to roll over and give in to your demands, no matter how reasonable you may thing them to be. They will fight, and sometimes fight dirty, to win. You have to be prepared to counter and be the target for abuse. At the same time, you have to be adept at forming coalitions with other investors in the firm since you will need their help to get managers to do your bidding. 

Read Full Post »

Yesterday, I examined Aswath Damodaran’s paper “Value Investing: Investing for Grown Ups?” in which Damodaran asked, “If value investing works, why do value investors underperform?”

Damodaran divides the value world into three groups:

  1. The Passive Screeners,” – “The Graham approach to value investing is a screening approach, where investors adhere to strict screens… and pick stocks that pass those screens.”
  2. The Contrarian Value Investors,” – “In this manifestation of value investing, you begin with the belief that stocks that are beaten down because of the perception that they are poor investments (because of poor investments, default risk or bad management) tend to get punished too much by markets just as stocks that are viewed as good investments get pushed up too much.”
  3. Activist value investors,” – “The strategies used by …[activist value investors] are diverse, and will reflect why the firm is undervalued in the first place. If a business has investments in poor performing assets or businesses, shutting down, divesting or spinning off these assets will create value for its investors. When a firm is being far too conservative in its use of debt, you may push for a recapitalization (where the firm borrows money and buys back stock). Investing in a firm that could be worth more to someone else because of synergy, you may push for it to become the target of an acquisition. When a company’s value is weighed down because it is perceived as having too much cash, you may demand higher dividends or stock buybacks. In each of these scenarios, you may have to confront incumbent managers who are reluctant to make these changes. In fact, if your concerns are broadly about management competence, you may even push for a change in the top management of the firm.”

We looked at Damodaran’s passive screeners yesterday, the contrarian value investors are up today, and tomorrow we’ll take a look at the activists.

The Contrarian Value Investors

Buying losers seems to work over a long time scale.

Damodaran:

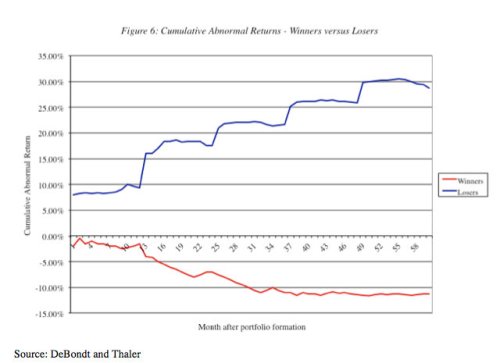
This analysis suggests that an investor who bought the 35 biggest losers over the previous year and held for five years would have generated a cumulative abnormal return of approximately 30% over the market and about 40% relative to an investor who bought the winner portfolio.

This evidence is consistent with market overreaction and suggests that a simple strategy of buying stocks that have gone down the most over the last year or years may yield excess returns over the long term. Since the strategy relies entirely on past prices, you could argue that this strategy shares more with charting – consider it a long term contrarian indicator – than it does with value investing.

Several select caveats:

• Studies also seem to find loser portfolios created every December earn significantly higher returns than portfolios created every June. This suggests an interaction between this strategy and tax loss selling by investors. Since stocks that have gone down the most are likely to be sold towards the end of each tax year (which ends in December for most individuals) by investors, their prices may be pushed down by the tax loss selling.

• There seems to be a size effect when it comes to the differential returns. When you do not control for firm size, the loser stocks outperform the winner stocks, but when you match losers and winners of comparable market value, the only month in which the loser stocks outperform the winner stocks is January.21

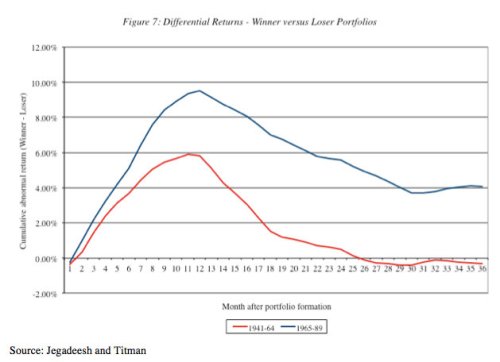
• The final point to be made relates to time horizon. There may be evidence of price reversals in long periods (3 to 5 years) and there is the contradictory evidence of price momentum– losing stocks are more likely to keep losing and winning stocks to keep winning – if you consider shorter periods (six months to a year). An earlier study that we referenced, by Jegadeesh and Titman tracked the difference between winner and loser portfolios by the number of months that you held the portfolios.22

Damodaran’s final point above – that price momentum works over short periods – is interesting:

Weird. The winner portfolio actually outperforms the loser portfolio in the first 12 months. Says Damodaran:

[L]oser stocks start gaining ground on winning stocks after 12 months, [but] it took them 28 months in the 1941-64 time period to get ahead of them and the loser portfolio does not start outperforming the winner portfolio even with a 36-month time horizon in the 1965-89 time period. The payoff to buying losing companies may depend heavily on whether you have to capacity to hold these stocks for long time periods.

Bad companies can be good investments

A more sophisticated version of contrarian value investing  is buying “unexcellent” companies and selling “excellent” companies. Damodaran’s rationale is as follows:

If you are right about markets overreacting to recent events, expectations will be set too high for stocks that have been performing well and too low for stocks that have been doing badly. If you can isolate these companies, you can buy the latter and sell the former.

Take note, franchise investors:

Any investment strategy that is based upon buying well-run, good companies and expecting the growth in earnings in these companies to carry prices higher is dangerous, since it ignores the possibility that the current price of the company already reflects the quality of the management and the firm. If the current price is right (and the market is paying a premium for quality), the biggest danger is that the firm loses its luster over time, and that the premium paid will dissipate. If the market is exaggerating the value of the firm, this strategy can lead to poor returns even if the firm delivers its expected growth. It is only when markets under estimate the value of firm quality that this strategy stands a chance of making excess returns.

The tale of Tom Peters’s In Search of Excellence:

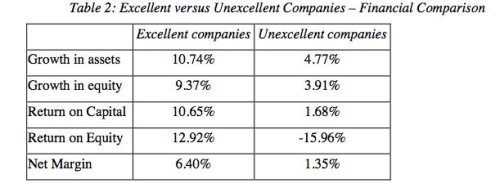
There is some evidence that well managed companies do not always make good investments. Tom Peters, in his widely read book on excellent companies a few years ago, outlined some of the qualities that he felt separated excellent companies from the rest of the market.23 Without contesting his standards, a study went through the perverse exercise of finding companies that failed on each of the criteria for excellence – a group of unexcellent companies and contrasting them with a group of excellent companies.

Here’s a statistical comparison of the two groups:

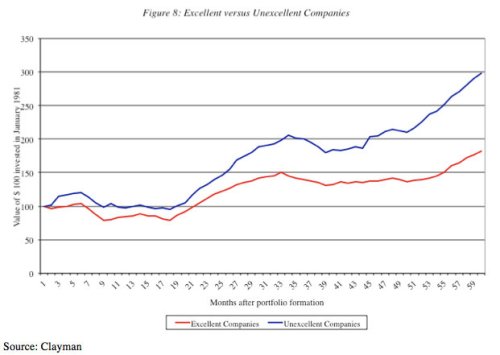
Clearly, “Excellent companies” are excellent, and “Unexcellent companies” suck (negative return on equity!). Confronted with the choice to invest in one group of the other, it’s a no-brainer. Or is it? Here are the returns:

Ruh roh. Says Damodaran:

The excellent companies may be in better shape financially but the unexcellent companies would have been much better investments at least over the time period considered (1981-1985). An investment of $ 100 in unexcellent companies in 1981 would have grown to $ 298 by 1986, whereas $ 100 invested in excellent companies would have grown to only $ 182. While this study did not control for risk, it does present some evidence that good companies are not necessarily good investments, whereas bad companies can sometimes be excellent investments.

A legitimate criticism of this study is that the time period is very short (5 years) and may be an aberration – it began, after all, right at the end of a tough bear market, where any stock with the fundamentals of the unexcellent companies would have looked like poison. How about a second study?

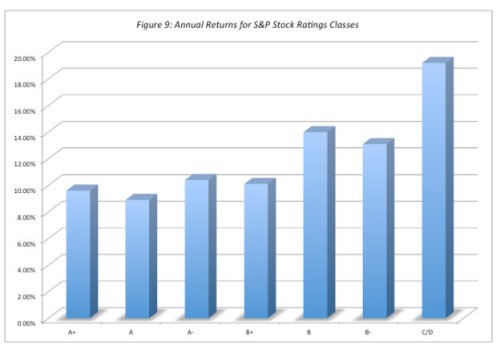
The second study used a more conventional measure of company quality. Standard and Poor’s, the ratings agency, assigns quality ratings to stocks that resemble its bond ratings. Thus, an A rated stock, according to S&P, is a higher quality investment than a B+ rated stock, and the ratings are based upon financial measures (such as profitability ratios and financial leverage). Figure 9 summarizes the returns earned by stocks in different ratings classes, and as with the previous study, the lowest rated stocks had the highest returns and the highest rated stocks had the lowest returns.

And here are the returns:

Looks like a pretty clear inverse relationship between rating and return. Sure, whereof rating, thereof “risk,” but I’m prepared to wear that “risk” for the return.

So contrarian value investing works. How do we mess this up?

a. Long Time Horizon: To succeed by buying these companies, you need to have the capacity to hold the stocks for several years. This is necessary not only because these stocks require long time periods to recover, but also to allow you to spread the high transactions costs associated with these strategies over more time. Note that having a long time horizon as a portfolio manager may not suffice if your clients can put pressure on you to liquidate holdings at earlier points. Consequently, you either need clients who think like you do and agree with you, or clients that have made enough money with you in the past that their greed overwhelms any trepidation they might have in your portfolio choices.

b. Diversify: Since poor stock price performance is often precipitated or accompanied by operating and financial problems, it is very likely that quite a few of the companies in the loser portfolio will cease to exist. If you are not diversified, your overall returns will be extremely volatile as a result of a few stocks that lose all of their value. Consequently, you will need to spread your bets across a large number of stocks in a large number of sectors. One variation that may accomplish this is to buy the worst performing stock in each sector, rather than the worst performing stocks in the entire market.

c. Personal qualities: This strategy is not for investors who are easily swayed or stressed by bad news about their investments or by the views of others (analysts, market watchers and friends). Almost by definition, you will read little that is good about the firms in your portfolio. Instead, there will be bad news about potential default, management turmoil and failed strategies at the companies you own. In fact, there might be long periods after you buy the stock, where the price continues to go down further, as other investors give up. Many investors who embark on this strategy find themselves bailing out of their investments early, unable to hold on to these stocks in the face of the drumbeat of negative information. In other words, you need both the self-confidence to stand your ground as others bail out and a stomach for short-term volatility (especially the downside variety) to succeed with this strategy.

Tomorrow, the activists.

DEEP VALUE 4 LIFE

(Hat tip Abnormal Returns)

Read Full Post »

Kinnaras Capital Management demonstrates characteristic tenacity in a new letter to Media General Inc (NYSE:MEG) sent after Kinnaras’s exclusion from the most recent earnings call:

I intended to voice those concerns on the Q1 2012 conference call but despite following directions to join the queue, it appears that I was not allowed to participate in this call. This is a poor response to an engaged shareholder. I have likely purchased more shares of MEG than you ever have, yet as an owner of the Company I was not allowed to ask pertinent questions regarding MEG’s operational and financing strategies simply because I have accurately pointed out the various failures you have helmed while at Media General.

In its two earlier lettera Kinnaras expressed frustration with the performance of MEG, and urged the Board to “take advantage of the robust M&A market for both newspaper and broadcast television and to sell all operating units of MEG in order to retire existing corporate and pension debt and achieve a share price shareholders have rarely seen in recent years.”

MEG is a provider of local news in small and mid-size communities throughout the Southeastern United States. It owns three metropolitan and 20 community newspapers and 18 network-affiliated broadcast television stations Virginia/Tennessee, Florida, Mid-South, North Carolina, and Ohio/Rhode Island.

The initial letter included Kinnaras’s sum-of-the-parts valuation, which Kinnaras Managing Member Amit Chokshi sees at $9.75 per share against a prevailing price of around $4.60.

Here’s the new letter:

Kinnaras also has on its website its recommendations to MEG shareholders ahead of the proxy vote.

No position.

Read Full Post »

The Economist has an article, High-speed slide, which discusses a recent study by Grant Thornton about the disappearance of the initial public offering (IPO) market in the U.S., and, in particular, the death of the small IPO. In the October 2009 study, Market structure is causing the IPO crisis, authors David Weild and Edward Kim argue that the recent paucity of U.S. IPOs is a result of the “market structure” failing the IPO, rather than a cyclical downturn. That may seem unlikely at first blush, but the data are compelling:

The first six months of 2009 represents the worst IPO market in 40 years. Given that the size of the U.S. economy, in real GDP terms, is over 3x what it was 40 years ago, this is a remarkable and frightening state of affairs. Only 12 companies went public in the United States in the first half of 2009, and only eight of them were U.S. companies. The trend that disfavors small IPOs and small companies has continued. The median IPO in the first half of 2009 was $135 million in size. This contrasts to 20 years ago when it was common for Wall Street to do $10 million IPOs and have them succeed.

The implication, say the authors of the study, is that the market is closed to most small companies:

From 1991 to 1997 nearly 80% of the IPOs were smaller than $50 million. By 2000 the number of sub-$50 million IPOs had declined to only 20% of the market. The market for underwritten IPOs, given its current structure, is closed to 80% of the companies that need it.

From page 8 the study, a graph showing the decline in the number of small IPOs (<$50M) relative to large IPOs ($50M+):

The Economist points out that the “50 or so” new companies to list this year is just “one-seventh of the level needed to offset the average annual loss of listed companies in recent years.”

The study discusses a number of possible causes of the decline, including the introduction of low-cost brokerages and new regulations and legislation. From page 4 of the study, a graph showing the decline in the number of IPOs and the timing of regulatory changes:

The Economist focuses on the impact of low-cost brokerages:

An accidental victim of this technological revolution, the report says, was the ecosystem that helped bring small firms to market and then nourished them once there. “It’s a bargain-basement market today,” says David Weild, a co-author of the report. “You get what you pay for, and that’s nothing but trade execution.”

The “high-frequency” traders who have come to dominate stockmarkets with their computer-driven strategies pay less attention to small firms, preferring to jump in and out of larger, more liquid shares. Institutional investors, wary of being stuck in an illiquid part of the market, are increasingly following them.

Another factor is the near-evaporation of research on small firms, which has been undone by the rise of passive index investing and by rules that banned the use of investment-banking revenues to subsidise analysts. With less funding to go around, analysts are increasingly concentrating on large, frequently traded shares, says Larry Tabb of TABB Group, a consultancy. The centre of gravity in research has shifted to “buy-side” firms, like hedge funds, which do not generally disseminate their work.

The authors of the study point to other regulatory and legislative acts, including the “order precedence rule,” commonly known as the “Manning Rule” after a legal case against Charles Schwab, the Gramm-Leach-Bliley Act, which saw the end of the Glass-Steagall Act of 1933 and formally allowed the combination of commercial banks, securities firms and insurance companies, Regulation Fair Disclosure, which devalued stock research, and the Global Settlement ruling, which has made research coverage tougher for issuers to secure. Sarbannes-Oxley was simply the final nail in the coffin.

The authors suggest two changes to reinvigorate the market, neither of which I find particularly palatable. They are the establishment of a new market segment without automated trade execution but with fixed trading commissions used to fund research and looser rules governing institutional investment in pre-IPO companies. These are band-aids that won’t get to the root cause of the problem. If the regulatory and legislative changes backfired on the U.S. IPO market, as the authors claim, perhaps winding back some that legislation would help it. The list of regulation and legislation detailed in the appendix of the study, stretching over the last three pages, is enough to choke a donkey. SarbOx has not received its fair share of the blame, possibly because the market was already an ex-market by 2002, the year Sarbannes-Oxley was enacted. The authors write that SarbOx was “a bit of a red herring” because “[online] brokerage and decimalization were significantly more damaging to the IPO market.” That’s all well and good, but it’s also plain that – bubble years aside – the smaller end of the market has further declined since the enactment of SarbOx. SarbOx has created an enormous regulatory and compliance burden on listed companies, and the corollary is not true: Fraud is as endemic as ever, and people still lose money to sheisters. The additional SarbOx regulatory burden cannot do anything other than reduce the number of companies for which being public is a worthwhile exercise. Smaller companies will incur proportionately higher costs in meeting the burden than their larger brethren and that means the additional regulatory burden will only ever be observable at the margin – the smaller end of the market. If we wish to see the IPO market back in health, we need to reduce the regulatory burden on all companies.

Update

The net effect of the decline in listings is striking (via BusinessWire):

The number of U.S. listed companies has fallen by more than 22 percent since 1991, or 53 percent when calculating in inflation-adjusted GDP growth. In contrast, exchanges in Asia are adding new listings faster than GDP growth rates.

According to the study, 360 new listings per year — a number not approached since 2000 — are required by the United States simply to replace the number of listed companies that are lost every year. Moreover, 520 new listings per year are needed to grow the U.S. listed markets roughly in line with GDP growth. In reality, the U.S. has averaged fewer than 166 IPOs per year since 2001, with only 54 in 2008.

Hat tip Jules.

Read Full Post »

The Official Activist Investing Blog has published its list of activist investments for August:

Ticker Company Investor
ADPT Adaptec Inc. Steel Partners
ANR Alpha Natural Resources Duquesne Capital Management
BARE Bare Escentuals Sandler Capital Management
CAMD California Micro Devices Corp Gamco Investors
CITZ CFS Bancorp Financial Edge Fund
DCS Claymore Dividend & Income Fund Bulldog Investors
FCM First Trust Four Corners Senior Floating Rate Income Fund Bulldog Investors
FPU Florida Public Utilities Co Energy Inc
FRZ Reddy Ice Holdings Inc. Avenir Corp
GBNK Guaranty Bancorp Patriot Financial Partners
GCS DWS Global Commodities Stock Fund, Inc. Western Investment
HBRF.OB Highbury Financial Inc. North Star Investment Management Co
HFFC HF Financial Corp Finacial Edge Fund
KFS Kingsway Financial Services Inc Joseph Stillwell
MRVC.PK MRV Communications Boston Avenue Capital; Spencer Capital
NUF Nuveen Florida Quality Income Municipal Fund Western Investment
PXD Pioneer Natural Resources Southeastern Asset Management
RATE Bankrate Inc. Coatue Management
RUSS.OB Whitney Information Network Inc Kingstown Capital Partners
SBSA Spanish Broadcasting System Inc Attica Capital Partners
SCSS Select Comfort Clinton Group
SNG Canadian Superior Energy Palo Alto Investors
SNS Steak & Shake Co The Lion Fund
SPA Sparton Corp Lawndale Capital Management
TMNG The Management Network Group Mill Road Capital
TXI Texas Industries Inc. Shamrock Activist Value Fund
VXGN.OB VaxGen Inc. Boston Avenue Capital; Spencer Capital
VXGN.OB VaxGen Inc. Steven Bronson; Mark Boyer
XOHO.OB XO Holdings Inc Amalgamated Gadget

Read Full Post »

We’re struggling to find value in this market. We’ve got a handful of interesting plays on the watch screen, but we don’t want to overpay and they don’t seem to come down, so we’re stuck. In the last two days alone, the stocks in our watch screen are up an average of 9.6%, when we want each to come down between 10-15% (or more). It’s frustrating, and it’s prompted us to wonder if the market is getting a little expensive.

The S&P500 is now up 56% from its March 9 low. That’s a big rally, but as this dshort.com chart demonstrates, big bear market rallies are not unusual (click chart to enlarge):

Four bad bears 91509

Hans Wagner of Trading Online Markets has an excellent analysis of the S&P500 P/E ratio today. According to the article, the historical P/E ratio for the S&P500 has a median of 15.7. Today, it stands at 139, which seems – ahem – quite high. Why so high?

Even with the recovery in the markets since the lows in March, the S&P 500 PE ratio remains very high as the trailing four quarters of earnings is so low. According to data from Standard & Poor’s on the S&P 500, as reported earnings for 99% of all reporting companies, creates an S&P 500 PE ratio of 122.41 as of June 30, 2009. The trailing four quarters of earnings was $7.51. Two years ago the as reported earnings for the S&P 500 companies was $84.92 for the quarter ending on June 30, 2007. The S&P 500 PE ratio was 17.70. This plunge in earnings is what caused the S&P 500 PE ratio to rise so high.

So is the market going higher? Hans has some interesting thoughts:

Using the December 2009 quarter the earnings forecast $39.35 and a PE ratio of 30 gives us a target price for the S&P 500 index of 1,181. On Friday September 11, 2009, the S&P closed at 1,044. A PE ratio of 25 gives us an S&P 500 index of 984. If the S&P 500 PE ratio remains between 25 and 30, we should see the S&P 500 index climb to a range of 1,146 to 1,375.

This examination of earnings and S&P PE ratios is telling us to expect a higher S&P 500 index throughout 2009, as long as the PE ratio remains in the 25-30 range. Whether this is correct, depends on several factors. First, are the earnings forecast correct? Investors should monitor earnings expectations throughout the year, looking for any changes either up or down. The estimates for all of 2010 are higher now than they were in June, indicating S&P is expecting a more robust recovery.

Time to crack out the Santana Champagne? Maybe not:

Yale University Professor Robert J. Shiller, author of Irrational Exuberance: Second Edition uses a modified PE ratio that smoothes out the volatility in the ratio. The denominator of this modified ratio is average inflation-adjusted earnings over the trailing 10 years. Shiller calls this modified ratio “p/e10.” Using this data the modified ratio “p/e10” produces a PE ratio of slightly over 15, which is very close to the median of 15.7. In December 2007, the beginning of the current recession, the “p/e 10” was 25.95. Since markets tend to cycle above and below the median, we should expect the “p/e 10” to fall further before turning back up.

Using December 2009 trailing four-quarter earnings of $39.95 times the median PE ratio of 15.7 gives us an S&P 500 index of 627. This gives us a range for the S&P index of a high of 1,375 assuming an S&P PE ratio of 30 to a low of 675 with a PE ratio of 15.7, the median.

And in sublime understatement:

The risk is to the down side.

So, if forecast earnings of $39.35 materialize and the S&P 500 P/E ratio remains between 25 and 30, we should see the S&P 500 index between 1,146 to 1,375. If, on the other hand, we use the median P/E ratio of 15.7, the S&P 500 index sinks to 627 – lower than the March 9 low of 666.79.

When might we return to the bear? We don’t know, but we like a contrary indicator. Yesterday Ben Bernanke called the U.S. recession “very likely over.” With the high priest of finance going long, we think it might be time to ring the bell and call the top. We want to hear what you think. Are we there yet, or is the market going higher? Nail your colors to the mast and place your bets in the comments before the close today. We need a closing price, a date and a reason. We’re taking 1,052.63 and September 15, 2009 based on our Bernanke Indicator. The winner gets the adulation of Greenbackd readers and the inaugural Greenbackd Gizzard-Squeezer Gong.

Read Full Post »