Warren Buffett’s favored market valuation metric, market capitalization-to-gross national product, has passed an unwelcome milestone: the 2007 valuation peak, according to GuruFocus:
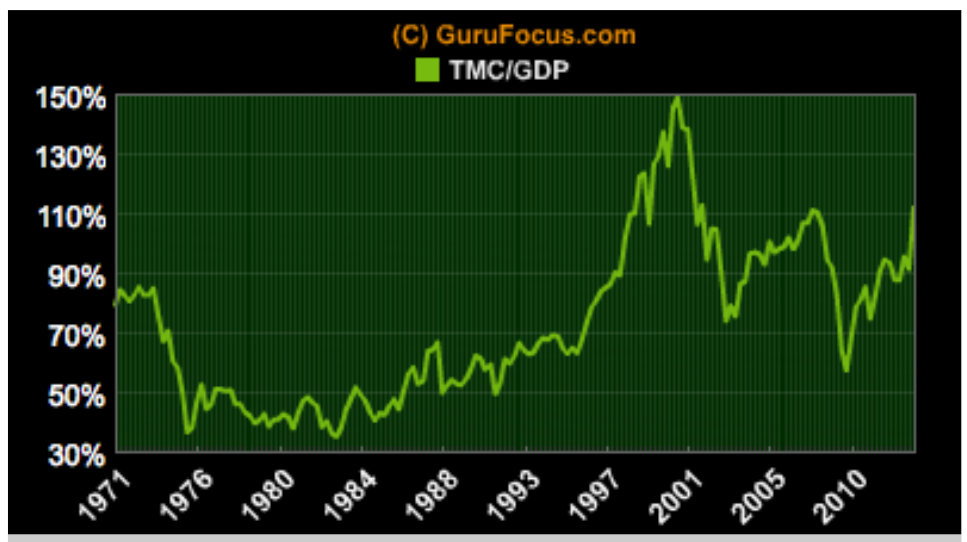
The index topped out at 110.7 percent in 2007, and presently stands at 111.7 percent. From GuruFocus:
As of today, the Total Market Index is at $ 17624.4 billion, which is about 111.7% of the last reported GDP. The US stock market is positioned for an average annualized return of 2.2%, estimated from the historical valuations of the stock market. This includes the returns from the dividends, currently yielding at 2%.
I’ve seen several arguments for why this time is different, and why it’s not a bubble. I don’t buy it. When we see clear skies, that’s all we can imagine, and so we extrapolate it over the horizon. From Seth Klarman’s latest:
Investing, when it looks the easiest, is at its hardest. When just about everyone heavily invested is doing well, it is hard for others to resist jumping in. But a market relentlessly rising in the face of challenging fundamentals–recession in Europe and Japan, slowdown in China, fiscal stalemate and high unemployment in the U.S.– is the riskiest environment of all.
…
[O]nly a small number of investors maintain the fortitude and client confidence to pursue long-term investment success even at the price of short-term underperformance. Most investors feel the hefty weight of short-term performance expectations, forcing them to take up marginal or highly speculative investments that we shun. When markets are rising, such investments may perform well, which means that our unwavering patience and discipline sometimes impairs our results and makes us appear overly cautious. The payoff from a risk-averse, long-term orientation is–just that–long term. It is measurable only over the span of many years, over one or more market cycles.
Our willingness to invest amidst failing markets is the best way we know to build positions at great prices, but this strategy, too, can cause short-term underperformance. Buying as prices are falling can look stupid until sellers are exhausted and buyers who held back cannot effectively deploy capital except at much higher prices. Our resolve in holding cash balances–sometimes very large ones–absent compelling opportunity is another potential performance drag.
For more on market value-to-GNP see my earlier posts Warren Buffett Talks… Total Market Value-To-Gross National Product, Warren Buffett and John Hussman On The Stock Market, FRED on Buffett’s favored market measure: Total Market Value-to-GNP, The Physics Of Investing In Expensive Markets: How to Apply Simple Statistical Models.
Order Quantitative Value from Wiley Finance, Amazon, or Barnes and Noble.
Click here if you’d like to read more on Quantitative Value, or connect with me on LinkedIn.


[…] Thanks to our friends at Greenbackd.com for supplying the US […]
LikeLike
Why not use GNP instead of GDP to capture foreign production? Then people can’t complain about it. Of course, GNP and GDP are highly correlated so it really doesn’t make much of a difference.
LikeLike
GNP is the theoretically purer metric. I have done that here and here. As you point out, they’re so similar that it makes no material difference which we metric we use.
LikeLike
One more item I’d like to comment on… just because this ratio goes above or below the magical 100% mark doesn’t mean the stock market will react in a certain way. Because the markets are forward looking, maybe they’re predicting more growth than before, and so stock prices could be very fair today. Obviously, being value investors here, we know the pitfalls and risks with forecasting too far and too optimistically into the future, but there are reasons why it might not drop significantly despite appearing overvalued based on historical data points.
LikeLike
Think your buying opportunity is starting to materialize… So the stage is set up for someday…today, next week, year…whatever for a nasty market but is there a chance to be long only and make money in that bear market. it’s one thing to be aware of the likelihood of a market crash or warning signs but do you advocate high cash or investing in any pockets of value. i’d be curious…trying to find it myself…the number of long biased/long only managers that produced postive returns in 2001-2002…also looking for info on correlation levels in prior bear markets between stocks…if 2008 and subsequent swoons in summer 10,11,12 had higher than normal correlations, maybe a garden variety bear dropping the market 30% can still have areas where managers can generate positive returns due to a lower level of correlations. pabrai and berkowitz i think both did that in 2001-02, and they follow a lot of the value stuff in terms of concentrated portfolios. i definitely want to see who else did that but i’m trying to get some data on the correlation levels in 2001-02 between stocks.
LikeLike
But…. it could go up to 150% of GDP – buy buy buy!
(obviously… just joking)
LikeLike
Also a fair point, even in jest. There’s nothing magical about the last peak. It’s very unlikely, but 2000 level overvaluation is possible.
LikeLike
I think this is a very important macro-econ measure, but there is a big problem in that it only captures publicly traded mkt cap, and over long periods, the public/private structure of the economy changes. The other problem is that the U.S. is not a closed system and a large amount of U.S. corp profits come from overseas (much more than foreign-corp profits that are earned in the U.S.).
LikeLike
All good points. One data point to bear in mind is that at year-end, the Wilshire 5000 had 3,687 stocks (not 5,000). There are fewer public companies today than there were in at the peak in 2000 (6,639 – See USAToday). If anything, the reduced number of listed stocks point to the total market capitalization being overstated, suggesting that the presently elevated TMC/GNP ratio might be understated. Noting, however, that the current ratio roughly agrees with the Shiller PE and Tobin’s q might suggest that it’s roughly accurate.
LikeLike