Butler|Philbrick|Gordillo and Associates have an interesting post called What the Bull Giveth, the Bear Taketh Away on the duration and magnitude of all bull and bear market periods in U.S. stocks since 1871.
For the purpose of the study below, we examined the S&P 500 price series from Shiller’s publicly available database to understand the duration and magnitude of all bull and bear market periods in U.S. stocks since 1871. We defined a bear market as a drop in prices of at least 20% from any peak, and which lasted at least 3 months. Bull markets were then defined as a rise of at least 50% from the bottom of a bear market, over a period lasting at least 6 months.
Chart 1 and Table 1 describe every bull market since 1871 in the S&P, including duration and magnitude information. The lesson from this analysis is uninspiring for equity bulls, as we will see. The core hurdle is that the current bull market has (through end of February) already delivered 105% of gains, against the median 124% bull market run through history (using monthly data). Of course, this means that, should this bull market deliver an average surge, investors can hope for less than 20% more growth from this cycle. Further, given that the median bull market has historically lasted 50 months, and we are currently in our 49th bull month, we are about due for a wipeout.
Chart 1. Bull Markets since 1871
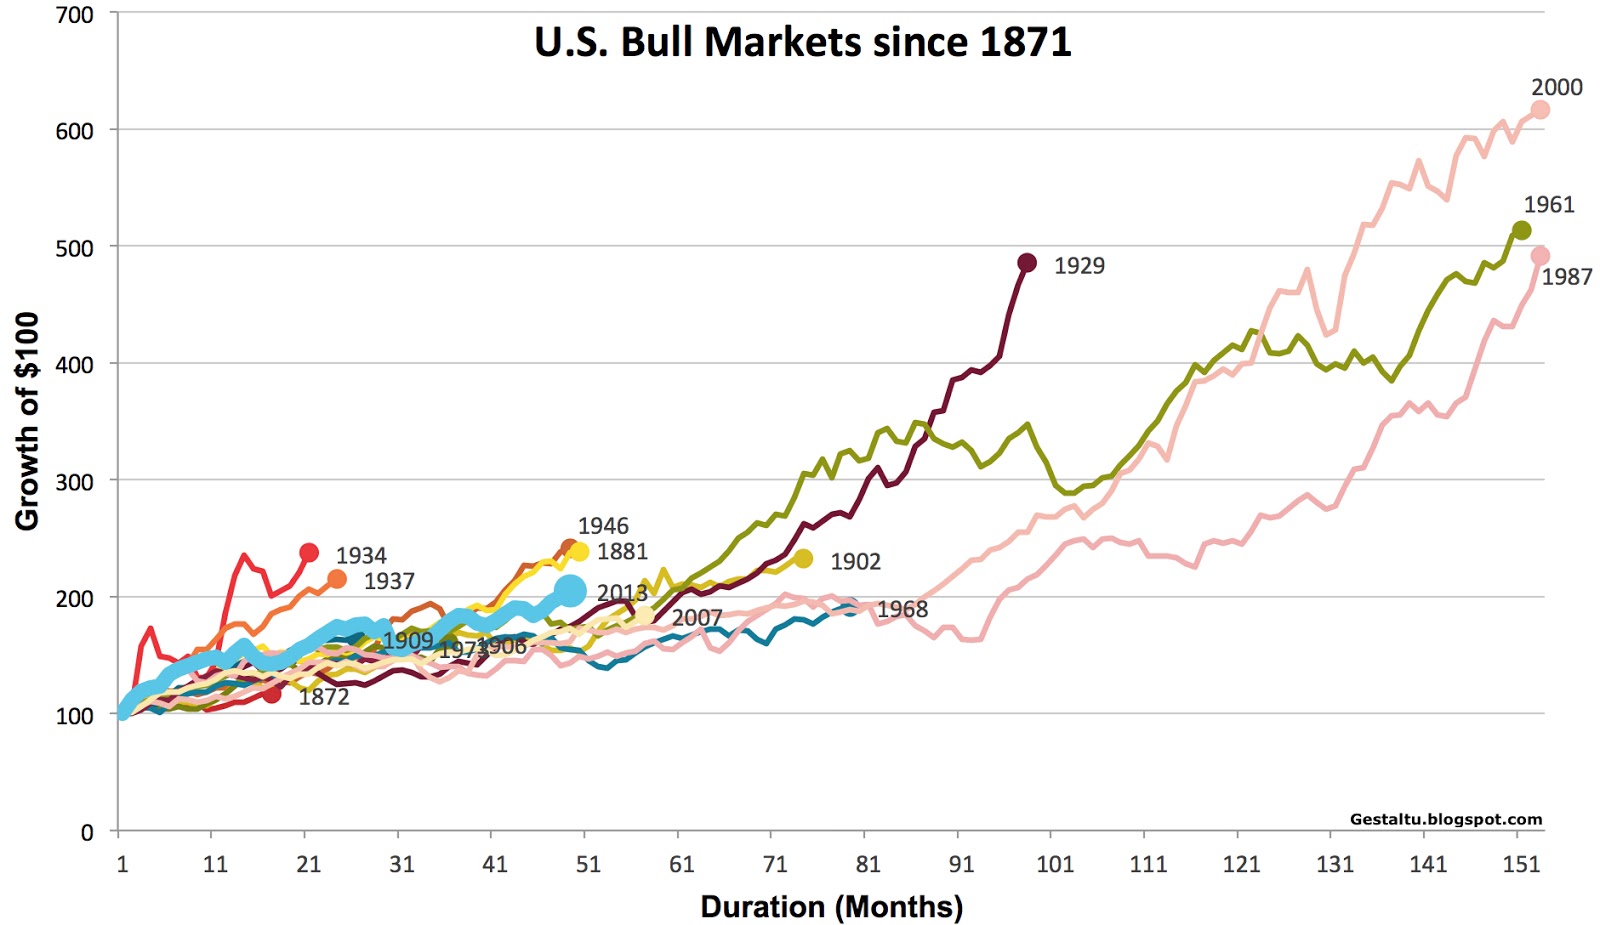
Source: Shiller (2013)
Table 1. Bull Markets since 1871 – Statistics
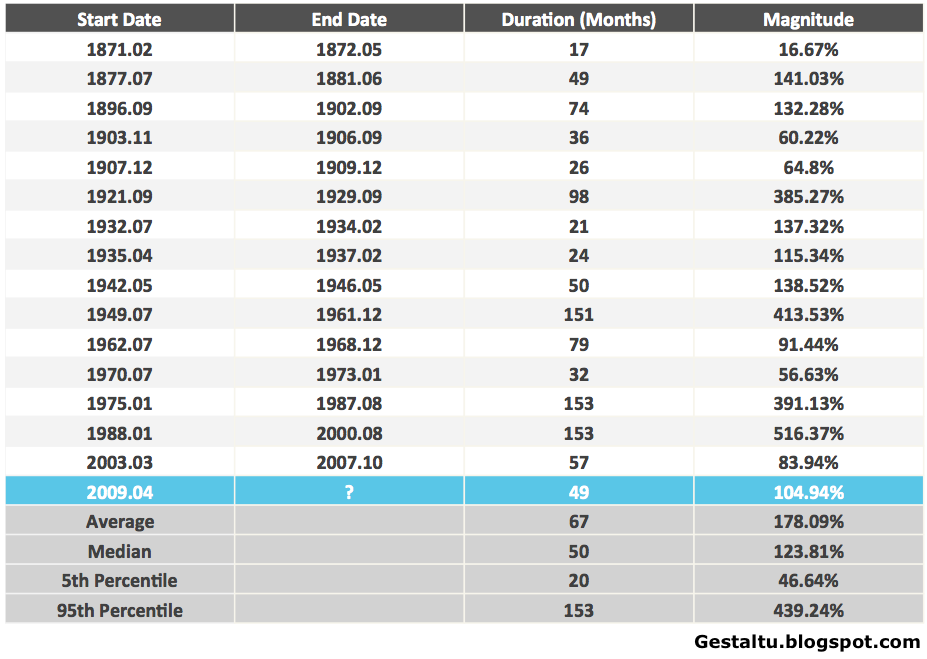
Source: Shiller (2013)
The current bull market has already delivered 85 percent of the gains, and lasted about as long, as the median historical bull market.
Read What the Bull Giveth, the Bear Taketh Away for the bear market equivalents of the preceding bull table and chart. Butler|Philbrick|Gordillo and Associates demonstrate that, if it follows the median bear market, it will wipe out 38 percent of all prior gains.
Buy my book The Acquirer’s Multiple: How the Billionaire Contrarians of Deep Value Beat the Market from on Kindle, paperback, and Audible.
Here’s your book for the fall if you’re on global Wall Street. Tobias Carlisle has hit a home run deep over left field. It’s an incredibly smart, dense, 213 pages on how to not lose money in the market. It’s your Autumn smart read. –Tom Keene, Bloomberg’s Editor-At-Large, Bloomberg Surveillance, September 9, 2014.
Click here if you’d like to read more on The Acquirer’s Multiple, or connect with me on Twitter, LinkedIn or Facebook. Check out the best deep value stocks in the largest 1000 names for free on the deep value stock screener at The Acquirer’s Multiple®.


[…] picture is a bit clearer when it comes to stock market gains. The mean bull market since 1871 is 67 months with 178% in gains. The median is 50 months and 123.8% gains. We’re longer than […]
LikeLike
[…] who follow quantitative market probability note that bullish stock market environments last, on average, 67 months. The current bullish economic environment, depending on where you call the low point, is […]
LikeLike
[…] little wobble in the market last week made me think of a post I ran in April last year on the duration and magnitude of all bull and bear market periods in U.S. stocks since 1871 using charts from Butler|Philbrick|Gordillo and Associates’ What the Bull Giveth, the Bear […]
LikeLike
Signs of a peak everywhere nevertheless we will now do the inevitable blow off top regardless of fundamentals it is the bull market way!
LikeLike
[…] Bull Market is about 4 years (or maybe it’s 3.2 years, or 5 years 7 months) – Apparently there isn’t exact agreement on what the length of the average bull market […]
LikeLike
[…] in US equities is now five years old. The median bull market since 1871 has historically lasted 50 months (about 4.17 years). The median bull market has delivered 124% gains. Using the SPDR S&P 500 […]
LikeLike
Here is the problem with this analysis… it uses median and averages… when has anything equaled a median or average? A median is the middle of a group of numbers; an average is the sum of all numbers divided by the number of items used. We see some bull markets — in fact 3 — lasting 150+ months – that is more than a decade… we also see some lasting 2 years or less… we only see one lasting ~50 months… I would bet this lasts for 10 years or more, meaning we haven’t even hit the middle… 2020 is when I dump stocks or long term investing. This actually goes hand in hand with USA energy and industrial resurgence… which likely won’t be felt in a significant way until 2015 or 2016. The market is always ahead. BTW I love the doom and gloomers… if it wasn’t for them 2013 would likely have been a bad year! Keep it up, and short short short!! (your time will come… but after you decide to throw in the towel).
LikeLike
[…] am Aktienmarkt gibt es eine durchschnittliche Lebenserwartung von Bullen- oder Bärenmärkten. Im Schnitt klettern die Kurse etwas mehr als vier Jahre, ehe es zu einer markanten Trendwende […]
LikeLike
Here’s something really scary!!
If you divide the percent bull market gain by the months of the duration of the bull market to get an average monthly return. There are only 2 times in the history that the average monthly return exceeds the current monthly return. It’s not the TECH BUBBLE only 3.37% It’s not the housing bubble of 07′ only 1.47%, its the 8 year period leading up to the great depression 1921-1929 an earth shattering 6.53% the 2nd is the bounce back in 1932-34 of 6.52%. The current market top S&P 1687 on May 24, 2013 divided by the bottom on March 6th, 2009 of 666 yields a whopping 253% divide that by the current 51 months and you get 4.96%. The really scary part is the average is less than 3% even the 95th percentile is less than 3%. So if the market is over-inflated by 86.5%, average market return of 2.66% subtracted from 4.96% = 2.3% divided by 2.66% = 86.5% the only other time in history this has ever happened was during the Great Depression where it was 145.5% 6.53%-2.66%=3.87% divided by 2.66% = 145.5% Now that the market is approaching a territory we have only been to once before, and we know how that ended, where do you think we’re headed now? Just some facts for thought. By the way the best approach for the short term is cash or short etf’s anything else will lose you big time in the next 1-3 years. check out: TZA,FAZ, SQQQ, SDOW, or other short stocks, you can leverage or not but definitely short this market, you will be thanking me later! The other best strategy is to hold cash, and wait until the bottom and buy at bargain prices. How do you know when we’re at the bottom?
When we break the 50 day moving average by 1% when the market dips below the moving average by less than 1% you buy, when it hits 3% below sell always buy when we break moving average by 1% to the upside this strategy will save you all the big losses, and help to see most of the gains.
LikeLike
How’s that shorting going for you after 1 year? if you speculate you get burned. Investing is ownership not gambling
LikeLike
All investments in the stock market are some form of speculation, If you read, I said the best strategy is to hold cash. Talk to me in a year or two. Long term the short play will be the best choice in the next 24 months. Send me another reply if I’m wrong. But I speculate not!
LikeLike
Two years now.
LikeLike
[…] Bull Markets Since 1871: Duration and Magnitude (Greenbackd) […]
LikeLike
[…] Bull Markets Since 1871: Duration and Magnitude (greenbackd.com) […]
LikeLike
[…] Bull Markets Since 1871: Duration and Magnitude […]
LikeLike
Good analysis but this is flawed. Using April 1st in this case is very misleading, SPY already back to 800 vs 666 by then, giving a very large difference in returns from the low (~105% vs ~140%). By this logic then we have exceeded the median and are not too far off from the average.
It also gives this bull market more of an acceleration than most. Furthermore, the average is skewed by 1929 and 2000, which were blowoff secular bull market peaks, whereas we are in a midcycle bull market which should be of less strength.
LikeLike
[…] Bull markets since 1871: Duration and magnitude – Greenbackd […]
LikeLike
[…] came across this chart on a blog called GestaltU thanks to a link on Greenbackd. Below you'll be looking at the current bull market versus all of the prior comparable bull […]
LikeLike
[…] It Can Solve the Boston Bombings (Slate) • Bull Markets Since 1871: Duration and Magnitude (Greenbackd) • Gold crash is an instructive whodunit of financial markets (theguardian) see also Gold and […]
LikeLike
[…] A look at bull markets since 1871. (Greenbackd) […]
LikeLike