My piece on S&P 500 forward earnings estimates and the overvaluation of the market generated a number of heated emails and comments. I didn’t know that it was so controversial that the market is expensive. I’m not saying that the market can’t continue to go up (I’ve got no idea what the market is going to do). My point is that there are a variety of highly predictive, methodologically distinct measures of market-level valuation (I used the Shiller PE and Tobin’s q, but GNP or GDP-to-total market capitalization below work equally as well) that point to overvaluation.
The popular price-to-forward operating earnings measure does not point to overvaluation, but is flawed because forward operating earnings are systematically too optimistic. It’s simply not predictive, mostly because it fails to take into account the highly mean reverting nature of profit margins. Here’s John Hussman from a week ago in his piece Investment, Speculation, Valuation, and Tinker Bell (March 18, 2013):
From an investment standpoint, it’s important to recognize that virtually every assertion you hear that “stocks are reasonably valued” is an assertion that rests on the use of a single year of earnings as a proxy for the entire long-term stream of future corporate profitability. This is usually based on Wall Street analyst estimates of year-ahead “forward operating earnings.” The difficulty here is that current profit margins are 70% above the long-term norm.
…
Most important, the level of corporate profits as a share of GDP is strongly and inversely correlated with the growth in corporate profits over the following 3-4 year period.
While I believe the Shiller PE and Tobin’s q to be predictive, there are other measures of market valuation that perform comparably. Warren Buffett’s favored measure is “the market value of all publicly traded securities as a percentage of the country’s business–that is, as a percentage of GNP.” Here he is in a 2001 interview with Fortune’s Carol Loomis:
[T]he market value of all publicly traded securities as a percentage of the country’s business–that is, as a percentage of GNP… has certain limitations in telling you what you need to know. Still, it is probably the best single measure of where valuations stand at any given moment. And as you can see, nearly two years ago the ratio rose to an unprecedented level. That should have been a very strong warning signal.
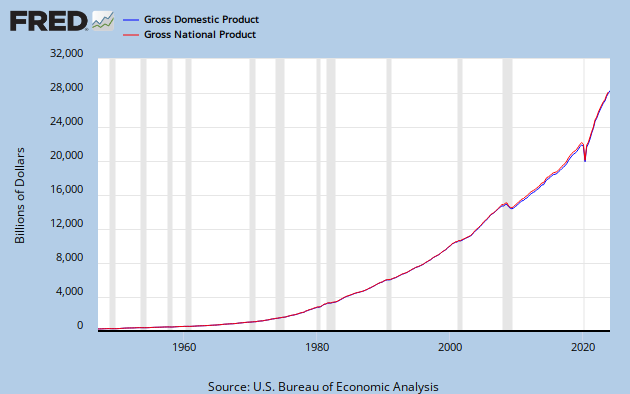
A quick refresher: GDP is “the total market value of goods and services produced within the borders of a country.” GNP is “is the total market value of goods and services produced by the residents of a country, even if they’re living abroad. So if a U.S. resident earns money from an investment overseas, that value would be included in GNP (but not GDP).” While the distinction between the two is important because American firms are increasing the amount of business they do internationally, the actual difference between GNP and GDP is minimal as this chart from the St Louis Fed demonstrates:
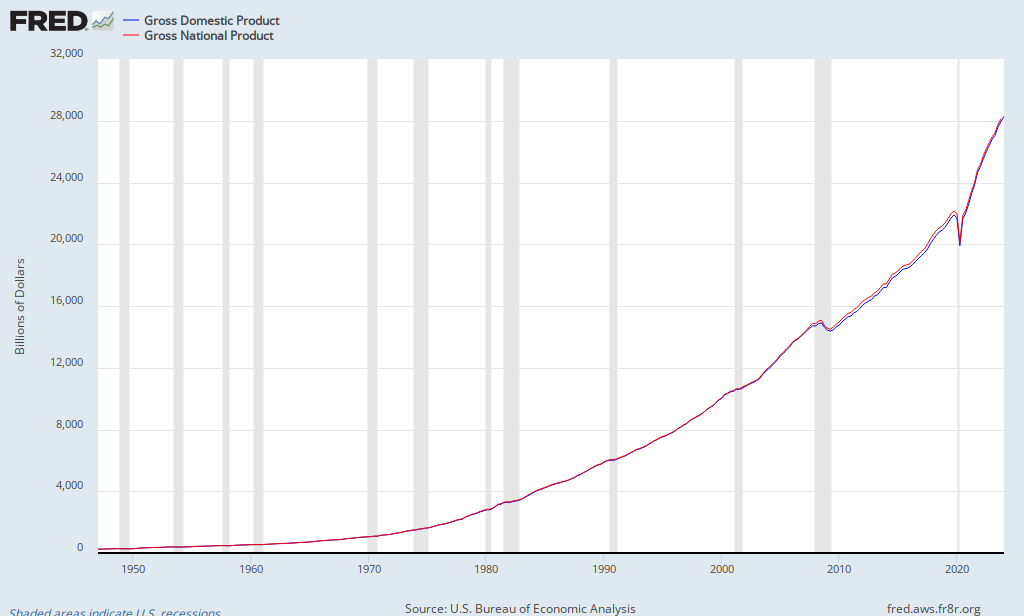
GDP in Q4 2012 stood at $15,851.2 billion. GNP at Q3 2012 (the last data point available) stood at $16,054.2 billion. For our present purposes, one substitutes equally as well for the other.
For the market value of all publicly traded securities, we can use The Wilshire 5000 Total Market Index. The index stood Friday at $16,461.52 billion. The following chart updates in real time:
Here are the calculations:
- The current ratio of total market capitalization to GNP is 16,461.52 / 16,054.2 or 103 percent.
- The current ratio of total market capitalization to GDP is 16,461.52 / 15,851.2 or 104 percent.
You can undertake these calculations yourself, or you can go to Gurufocus, which has a series of handy charts demonstrating the relationship of GDP to Wilshire total market capitalization:
Chart 1. Total Market Cap and GDP
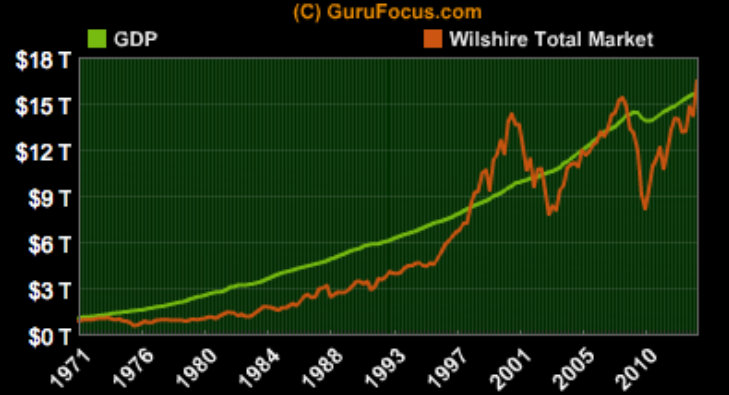
Chart 1 demonstrates that total market capitalization has now exceeded GDP (note the other two auspicious peaks of total market capitalization over GDP in 1999 and 2007).
Chart 2. Ratio of Total Market Capitalization and GDP
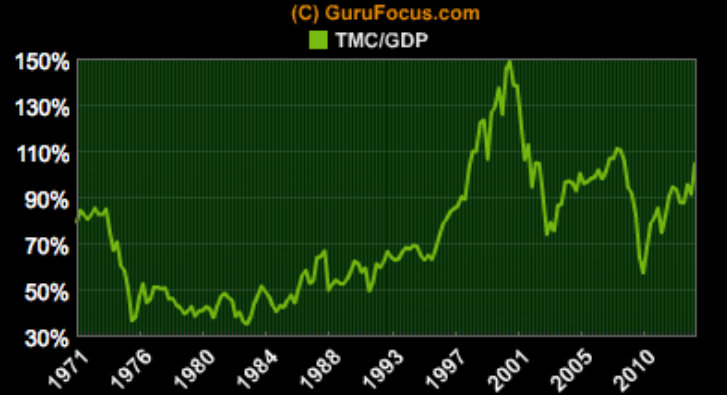
Chart 2 shows that the current ratio is well below the ratio achieved in the last two peaks (1999 and 2007), but well above the 1982 stock market low preceding the last secular bull market.
But, so what? Is the ratio of total market capitalization to GDP predictive?
In this week’s The Hook (March 25, 2013) Hussman discusses his use of market value of U.S. equities relative to GDP, which he says has a 90% correlation with subsequent 10-year total returns on the S&P 500:
Notably, the market value of U.S. equities relative to GDP – though not as elevated as at the 2000 bubble top – is not depressed by any means. On the contrary, since the 1940’s, the ratio of equity market value to GDP has demonstrated a 90% correlation with subsequent 10-year total returns on the S&P 500 (see Investment, Speculation, Valuation, and Tinker Bell), and the present level is associated with projected annual total returns on the S&P 500 of just over 3% annually.
Here’s Gurufocus’s comparison of predicted and actual returns assuming three different ratios (TMC/GDP = 40 percent, 80 percent, and 120 percent) at the terminal date:
Chart 3. Predicted and Actual Returns
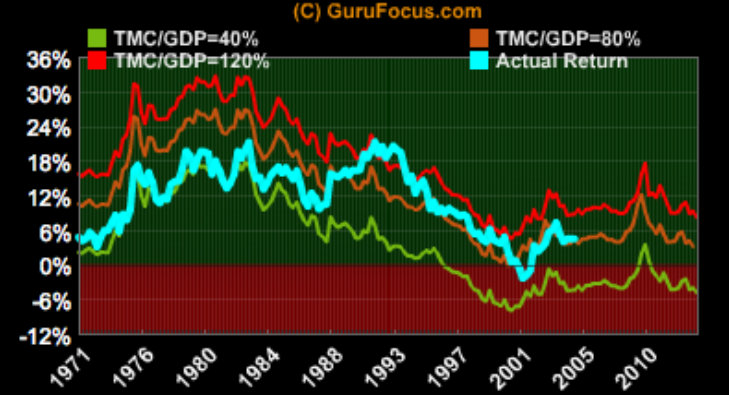
Chart 3 shows the outcome of three terminal ratios of total market capitalization to GDP. Consider the likelihood of these three scenarios:
- A terminal ratio of 120 percent (equivalent to the 1999 to 2001 peak) leads to annualized nominal returns of 8.1 percent over the next 10 years.
- A terminal ratio of 80 percent (the long-run average) leads to annualized nominal returns of 3 percent over the next 10 years.
- A terminal ratio of 40 percent (approximating the 1982 low of 35 percent) leads to annualized nominal returns of -5 percent over the next 10 years.
For mine, 1 seems less likely than scenarios 2 or 3, with the long run mean (scenario 2) the most likely. For his part, Buffett opines:
For me, the message of that chart is this: If the percentage relationship falls to the 70% or 80% area, buying stocks is likely to work very well for you. If the ratio approaches 200%–as it did in 1999 and a part of 2000–you are playing with fire.
Gurufocus’s 80-percent-long-run-average calculation agrees with Hussman’s calculation of average annualized market return of 3%:
As of today, the Total Market Index is at $ 16461.5 billion, which is about 104.3% of the last reported GDP. The US stock market is positioned for an average annualized return of 3%, estimated from the historical valuations of the stock market. This includes the returns from the dividends, currently yielding at 2%.
Here’s Buffett again:
The tour we’ve taken through the last century proves that market irrationality of an extreme kind periodically erupts–and compellingly suggests that investors wanting to do well had better learn how to deal with the next outbreak. What’s needed is an antidote, and in my opinion that’s quantification. If you quantify, you won’t necessarily rise to brilliance, but neither will you sink into craziness.
On a macro basis, quantification doesn’t have to be complicated at all. Below is a chart, starting almost 80 years ago and really quite fundamental in what it says. The chart shows the market value of all publicly traded securities as a percentage of the country’s business–that is, as a percentage of GNP. The ratio has certain limitations in telling you what you need to know. Still, it is probably the best single measure of where valuations stand at any given moment. And as you can see, nearly two years ago the ratio rose to an unprecedented level. That should have been a very strong warning signal.
The current ratios of total market capitalization to GNP and GDP should be very strong warning signals. Further, that they imply similar returns to the Shiller PE and Tobin’s q, suggests that they are robust.
Order Quantitative Value from Wiley Finance, Amazon, or Barnes and Noble.
Click here if you’d like to read more on Quantitative Value, or connect with me on LinkedIn.


[…] the updated St Louis Fed’s FRED on Warren Buffett’s favored market measure, total market […]
LikeLike
there have been some developments that have made these ratios less predictive, particularly wall street owns much more of itself than in the past. About half of the assets of nonfinancial corporate businesses are financial assets (stocks, bonds, etc) . As recently as 1980, this number was about 27%. This is cash flowing to corporations that would have typically flowed to individuals and can seriously change what the fair value of these ratios should be.
LikeLike
[…] see my earlier posts Warren Buffett Talks… Total Market Value-To-Gross National Product, Warren Buffett and John Hussman On The Stock Market, FRED on Buffett’s favored market measure: Total Market Value-to-GNP, The Physics Of Investing […]
LikeLike
[…] by Gross National Product. (I’ve also examined market value-to-GNP several times. See Warren Buffett and John Hussman On The Stock Market, FRED on Buffett’s favored market measure: Total Market Value-to-GNP, The Physics Of Investing […]
LikeLike
And now I have to make the very very obvious suggestion…..perform this analysis on Japan!!!!
LikeLike
Thank you for your excellent article.
Just a few comments for thought.
o Schiller uses CPI for inflation adjustment,
It has been widely stated that CPI through hedonic and substitution adjustments etc understates inflation. if so, Schiller PE understates value.
o 40% of S&P earnings comes from overseas now, so comparing to only US economy also seems to understate value.
Wilfred
LikeLike
Hi Wilfred,
Thank you for the kind words. I’ve looked at the Shiller PE using Shadowstats’ CPI calculation. It reduces the Shiller PE as you’d expect: Shiller PE10 calculated using Shadowstats’ CPI. I don’t think the composition of earnings should change the ratio, but you can look at the other posts here using different metrics (for example, Buffett’s preferred metric total market capitalization-to-gross national product). All point to overvaluation of approximately the same magnitude.
LikeLike
If you look at Buffett’s comments, he does not appear to believe that the market is overvalued, so he appears to disagree with you. Either he has misapplied his own model, has changed his model, or you have misapplied his model. I believe it is the later. So, what have you done wrong. Well, Buffett says to just look at GNP and total market capitalization as a guideline that, if it is way out of wack, can indicate the market is too low or too high. Here, that ratio is simply not out of wack. Second, Interest rates are not just color to Buffett, they are determinants of value. Companies are worth more when interest rates are low and are worth less when interest rates are high. As Buffett says, interest rates are like gravity, when they are higher, the value of all assets fall. So, you are not considering the effect of interest rates sufficiently.
As far as investor expectations, they do not rest on profit margins or forward estimates. It appears quite obvious that investor expectations are low, including your own, and I think all the empirical data about investors views on the stock market support this but if you disagree, fine, I don’t feel any need to argue about it.
The main difference between you and Buffett is that Buffett wrote a long, analytical article exploring and analyzing all the factors, including looking at the GN to total market capitalization as a guide, especially when at extremes. You seem to want to latch on to a formula to provide absolute conclusions, without an appropriate analysis of all the factors.
LikeLike
[…] and reading. I got some good reading in yesterday and came across this excellent article by Toby Carlisle at Greenbackd about the state of the overall market and thought I’d share […]
LikeLike
Has there ever been a time in the past 100 years where cash, bonds and stocks all seemed to offer such poor future returns? I think one can make the case that stocks don’t offer great returns over the next 10 years, but are they any worse than Bonds or Cash?
Personally I’m sitting on the fence …55% stocks, 15% bonds and 30% cash. Well not quite on the fence; I’m leaning towards stocks being overvalued, but I’m no where near as concerned as I was from 1998-2001. I was more concerned about stock price level between 2003-2007 than I am now.
I’m not a professional, I just look after my families savings towards retirement. I’ve been doing my own thing since 1999 and only once was I really confident to buy stocks – and that lasted for all of about 6-9 months in 2009 before everything went back to fairly valued.
I guess in short I will always sit on the fence until something seems overwhelming obvious. I don’t see that we are in one of those periods with US stocks, particularly given the other options.
LikeLike
James Montier calls it the “age of financial repression.” See his piece, “The 13th Labour of Hercules: Capital Preservation in the Age of Financial Repression” on the GMO research page here.
LikeLike
Thanks Tobias,
I read the article…very interesting stuff. Not sure I would draw any definitive conclusions from it with respect to confidence in the current value of the market.
LikeLike
Agreed. I point to it only because Montier outlines the two ugly alternatives (1. assume financial repression is here to stay, and hence be more heavily weighted to stocks vs 2. assume mean reversion at some point, and wait for a better pitch), and then asks, “What if my choice is wrong?”:
The permanent impairment of capital in the second choice is 50 percent. Ugly.
LikeLike
I anxiously await a period when decisions of where to invest seems much more clear.
I respect Prem Watsa and he is very negative (as you probably know he’s hedged his entire portfolio). His great fear is the de-leveraging at the private level that has yet to take place. I don’t pay much attention to grand predictions – even if he was dead on in 2008, but with so much uncertainty about where the market should be – even among like minded individuals, I suspect we will see some major volatility over the next several years with weak overall returns. Hopefully that presents some opportunities as it did in 2009.
LikeLike
Agreed. Enough with this macro analysis. I want to do some old-fashioned stock pickin’.
LikeLike
I believe it was you I saw give a lecture about simple systems being a ceiling (found a link of Stingy Investor I believe) – found that to be very fascinating and compelling stuff. Looked you up in the hope there was some way for a small Canadian investor to take advantage of such smarts like an easy to buy fund. I presume from reading your site that isn’t the case.
LikeLike
Thank you for the very kind comment. One does not exist presently, although that is the medium-term plan.
LikeLike
Tobias, despite your references to Buffett, it seems pretty clear from his comments that he doesn’t agree with you that he market is currently significantly overvalued, or even overvalued at all. Thus, Buffett has either changed his methodology or he is on error applying his methodology or you are in error.. I suggest it is the latter. However, it appears you are 100 percent convinced of your view. I have no interest in arguing with you. Since you believe you are correct, It does not appear you have any need for, or interest in, learning from me why the market s not overvalued, since you are certain my view is incorrect. Best of luck to you.
LikeLike
Well, his preferred method seems to have been total market cap to GDP according to Buffett. But if you are referring to Graham’s Central Value calculation for the stock market, let’s discuss. He said take the average earnings for the past 10 years and divide it by twice the interest rate on high grade bonds (Moody’s AAA rated bonds more specifically). Then he said to add an arbitrary 50% to that.
S&P avg. operating earnings for 10 yrs (2003-12) = $75.25. Moody’s Seasoned Aaa Corporate Bond Yield = 3.9%. ($75.25 / 7.8%) * 1.5 = 1,447. With the S&P at 1,569, that implies its less than 8% overvalued but within a range Graham would find acceptable.
S&P avg. as reported earnings for 10 yrs (2003-12) excluding 2008 earnings of $14.88 which is clearly an outlier and 1 in 75 yr event = $69.63. ($69.63 / 7.8%) * 1.5 = 1,339 implying the market is less than 15% overvalued.
S&P avg. operating earnings for 10 yrs (2003-12) excluding 2008 earnings of $49.51 = $78.11. ($78.11 / 7.8%) * 1.5 = 1,502 implying the market is about 4% overvalued.
See bottom of pg. 4
http://www.scribd.com/doc/131002265/Ben-Graham-1963-Lecture-Securities-in-an-Insecure-World
http://research.stlouisfed.org/fred2/series/AAA/
LikeLike
Thanks, Jeff.
LikeLike
simplistic formulas can give you clues as to whether the market is overvalued or undervalued, particularly if the formulas yield extremes, but they are certainly not conclusive, particularly when not at extremes. Substituting simple formulas for comprehensive analysis is not something Buffett does. In fact, if you read his article that you site, he provides a comprehensive analysis, not just blindly following a simple formula. You would do well to do likewise. You might find that the market is fairly valued. You might realize stocks have potential to deliver excellent returns over time.
LikeLike
[…] the St Louis Fed’s FRED on Warren Buffett’s favored market measure, total market […]
LikeLike
For what it is worth, the Shiller PE is based on “as reported earnings” while trailing and forward S&P numbers are generally based on “operating earnings.” Operating earnings exclude unusual items, so that is the number that should be used. To get a sense of the difference between the two, for LTM the as reported earnings are $86.50 vs $97.4 for operating earnings. Not sure why Shiller uses the lower number that doesn’t back out unusual items. It results in the Shiller PE being a bit inflated. When you see profit margins for the S&P, you need to be aware of what underlying earnings data is being used. Based on current numbers, its 9% based on operating and 8% based on as reported. Could make a big difference if you do any normalized margin analysis. I am not saying forward earnings are the whole story though. There is a lot more to it. Need to come up with earnings power, which takes me to my next point.
Graham did not just take an avg. of lets say the last 10 years earnings and call that earnings power. He threw out outlier years. And he only used the avg. after that adjustment if it was a mature business. If there was growth to the business, he would incorporate that. So if a company had earnings of $1, $2, $3, $4, $5 and $6 he might say the earnings power is $7 instead of $3.5 (the avg. of those 6 years). Can’t remember what page of Security Analysis that is on. But I know it is in the 1951 edition.
LikeLike
Shiller uses “as reported” earnings because operating earnings are pure fantasy. When you play golf, you write your score for the hole – that’s “as reported” earnings. The part of the scorecard where you write how you would have scored except for all the extra shots – that’s operating earnings.
LikeLike
You are extremely pot committed then. Nothing I said in that comment is controversial. Even Graham excluded unusual items.
LikeLike
If anything, I’d be out of the pot. I don’t know what the market is going to do. All I know is that it is expensive according to the Shiller PE, Tobin’s q and total market capitalization-to-GNP.
LikeLike
You being out of the market is what I mean by being pot committed. You are pot committed to your ideas, don’t seem to be open to other reasonable arguments, and its scared you out of the market because you believe a 40%-50% correct is coming even though that has never happened in the U.S. without a recession. If you believe a recession is coming, I haven’t seen you say it or make an argument for it. I would be open to that argument. And of course timing would be key. Regarding the Shiller PE, it needs deeper thought put into it. Margin normalization will happen, but that will take a long long time because of interest rates. I could go on and on. I don’t doubt the market is overvalued here, but 104% for the total market cap to GDP ratio is not a sell signal. 120%+ might be. If the market remains flat or pulls back a little this summer, which is likely if Q1 and Q2 data come in soft since it would change forward estimates (don’t get stuck with that comment, of course there is more to the story than that), then that ratio will be below 100%. 80% (Buffett’s view of low point) to 100% is not crazy. 120%+ is crazy. In between is a time to be cautious. Being fully out of the market is a bit bold, but to each their own. You might feel justified in your viewpoint if this market pulls back 10%-15% this summer, but I think you will miss a great buying opportunity if you remain in cash after that.
Juan, unusual items should generally be excluded. Graham would say if a company has restructuring costs that they call unusual but have a history of a lot of restructuring costs, then you shouldn’t back them out. So some you have to be more thoughtful about. But generally speaking, unusual items should come out.
LikeLike
Good luck, Jeff.
LikeLike
It’s also worth noting that Graham never did anything like the Shiller PE. There is a reason for that.
LikeLike
might be time to leave simplistic formulas behind and do some comprehensive analysis. you might come to a different conclusion.
LikeLike
Jeff,
If you’re using the average of several years, as the Shiller PE does, wouldn’t it be best to include unusual items, and to assume that history is better than nothing in trying to predict the frequency and magnitude with which unusual items will hit the company in the future?
You can disagree with the number of years used for to get the average, but I don’t see how you can disagree with the general idea.
LikeLike
Juan, I responded to you above. I would also like to add that unusual items shouldn’t be a part of a valuation for a company. And for the market, it is just the addition of all the companies. If you were selling a business, you would take them out. And the buyer would be fine with excluding them. It’s somewhat theoretical really. But Graham agreed with the idea. In rare cases he would leave them in, but generally he pulled them out.
LikeLike
One other thing to note. Companies don’t report “operating earnings.” S&P comes up with the numbers themselves. You seem to imply that companies come up with the numbers. No, it’s S&P. I presume they use their heads and only exclude truly unusual items.
LikeLike
I’m very sorry for this silly question, but in Mr. Buffett’s 2001 article the graph shows that Total Mkt. Value/GNP peaked in the year 2000 at 190%. Why do charts 1 and 2 in this article show a ratio of 150% or so for the same period? Perhaps Mr. Buffett is using different numbers?
It’s a big difference – bigger than the difference between 80% (mentioned by Mr. Buffett as a ratio where it would be good to buy), and 103% (mentioned my Mr. Carlisle as today’s expensive ratio).
LikeLike
It’s a great question, and I’m not entirely sure of the answer. The units on the Wilshire 5000 no longer track billions of dollars on a one-for-one basis. The ratio is now something like one index unit:$1.15 billion, so the Wilshire 5000 index units slightly understate the actual total market capitalization. According to the Wilshire 5000 website, the total market value (full capitalization) as at February 28 was $18.3 trillion, so now roughly $19.2 trillion, which implies a total market capitalization-to-GNP ratio of 120 percent. Gurufocus compares each to its own mean, resulting in a ratio now of around 105 percent versus a ratio of ~150 percent in 2001 at the time of Buffett’s remarks. It’s not an entirely satisfactory answer, and I’m trying to work through it to find a better one. Hope that helps.
LikeLike
Yes, this helps. Thank you!
LikeLike
According to http://www.ey.com/GL/en/Newsroom/News-releases/News_Equity-markets-in-emerging-economies the market capitalization to GDP for emerging markets and in particular China is 40%. Does that mean you are currently looking for stocks to pick there? Or do you think the statistics only hold for USA?
Dan
LikeLike
I don’t know about China. There are all kinds of problems with the data and I don’t know if anyone has tested the relationship between GNP and total market capitalization in emerging markets.
LikeLike
The difference between countries is enormous. Examples are Taiwan where the ratio is 215 to Czech Republic where it is 28 http://seekingalpha.com/article/297518-why-emerging-markets-are-attractive-relative-to-developed-markets. Given this range between countries it would not be too surprising if the range for one country could change from lets say 100 to 120 in 50 years. My feeling is (but I couldn’t find the data – can you?) that privatizations have made the share of economy run by private companies compared to public higher now than 50 years ago. If so it should be expected that the TMC/GDP quotient should be higher. I am not at all sure of this, but I think it is worth contemplating?
LikeLike
I’m with you Tobias. The data is the data.
LikeLike
Sh
No offense, it is a stretch to say that the data you provide is at all comprehensive, or that the process you use is at all rigorous. You cite Warren Buffett, but you leave out economic variables that he believes affects stock prices. For example, you fail to discuss or analyze interest rate at all, despite, as Warren Buffett says, “the effects can be huge on values”. Another critical variable is the dollars investor expect to get from companies in which they invest. Arguably, presently, those expectations aren’t great because confidence in the American economy is relatively low after the recent crash.
In other words, I find the analysis done by Warren Buffet in his articles both comprehensive in the presentation of data, and rigorous. While you cite a few little bits from those articles, you simply fail to utilize the framework Buffet explained was essential. If you analyzed the critical variables that Buffett explains are essentially, you might come to a different conclusion. I have done so and my conclusion is that the market is approximately fairly valued, if not slightly undervalued.
The analysis you provide does not meet any of the critieria of scientific analysis, by the way. Essentially, you have pointed up some very gross correlations and made conclusions that are not sufficiently well founded, lacking both any theoretical foundation or any rigorous statistical analysis.
LikeLike
Mark,
Thank you for your comment. Buffett provides three examples to demonstrate that it is not the change in GNP that has the most impact on returns, but the starting ratio of total market capitalization to GNP. He sets out the interest rates and investor expectations about returns to provide some color and explain the elevated/depressed level of the market. Interest rates and investor expectations do not factor into his model, which has two inputs: GNP and total market capitalization. I do not dispute that interest rates are low. You seem to be saying that investor expectations are low, but I would suggest that they are high because profit margins are well above average, and forward estimates are higher still. Those two points suggest the market is expensive, and if we look at the model proposed by Buffett, I don’t see how we can come to any other conclusion. The fact that the Shiller PE and Tobin’s q ratio roughly agree with the conclusion available from Buffett’s measure is further support for my contention that markets are expensive, and returns will be depressed.
LikeLike
We had a good convo, no heat! I love debates. I would agree with the GDP-to-total market capitalization data saying the market is modestly overvalued. Looking at the Shiller PE and saying the market is overvalued by 40% is a huge stretch to me, but we’ve already been over that. Hussman, by the way, is extremely pot committed to the market tanking. He has been saying it for 3+ years, so not sure he is the best guy to point to. You know what you’ll get with him. And as the market has doubled, he keeps getting louder. Regarding margins, of course they will normalize. When? What has driven the increased margins thus far? Need to have a deeper discussion on that if you want to be more convincing. 50% of the increased margin is due to lower interest rates. So if you want the margins to normalize, you have to make a case for interest rates jumping up soon. That will be tough with the current Fed policy, and given the fact that if bad things happen in Europe it results in pushing U.S. rates down further, not up. Howard Marks believes interest rates will rise as the economy heals. So yeah, margins would come down (with a lag of course) while E would be going up. What makes up the other 50%? Weak labor market, U.S. businesses reach max efficiency which is only achievable in difficult times such as these, I don’t know. But to the extent weak labor markets are part of it, a strengthening labor market would be the result of a stronger economy and thus E would be going up again as margins contract. This idea that margins are just going to whip back to historical levels soon just because Hussman wants them to I think is a bit weak. Need more meat to convince.
LikeLike
It’s silly to engage in woolly speculation without any data or a rigorous process. The data are damning: The current Shiller PE of 23.20 is 40 percent over its long-run mean of 16.47. The current Tobin’s q of 0.92 is 41 percent over its long-run mean of 0.65. The current ratio of total market capitalization to GDP of 103 percent is 29 percent above its long-run mean of 80 percent. I don’t know what causes the market to revert to its long-run mean valuation, but it has in the past and it will likely do it again. The margins have already started to come down, so you have to demonstrate what pumps margins back up.
LikeLike
tobias, you process has some data but it provides neither comprehensive data, nor a rigorous process. Instead, it blindly follows simplistic formulas. You might find that comprehensive data, with a full analysis in a rigorous process, might yield a different answer. Reading Buffett” article again might help, as he does both, whereas you are doing neither.
LikeLike