Feeds:
Posts
Comments

Archive for the ‘Behavioral economics’ Category

Wes sent through this outstanding more-than-30-year-old speech, Trying Too Hard (.pdf), which foreshadows many of the ideas we discuss in Quantitative Value, so much so that I feel that I should point out that neither Wes nor I had read it before we wrote the book. The speaker, Dean Williams, named the speech for this story:

I had just completed what I thought was some fancy footwork involving buying and selling a long list of stocks. The oldest member of Morgan’s trust committee looked down the list and said, “Do you think you might be trying too hard?” A the time I thought, “Who ever heard of trying too hard?” Well, over the years I’ve changed my mind about that. Tonight I’m going to ask you to entertain some ideas shoe theme is this: We probably are trying too hard at what we do. More than that, no matter how hard we try, we may not be as important to the results as we’d like to think we are.

The speech covers the following themes, among others:

  • Prediction

…[M]ost of us spend a lot of out time doing something that human beings just don’t do very well. Predicting things.

  • Forecasting, information, and accuracy

Confidence in a forecast rises with the amount of information that goes into it. But the accuracy of the forecast stays the same. 

  • Expertise and forecasting

And when it comes to forecasting – as opposed to doing something – a lot of expertise is no better than a little expertise. And may be even worse.

  • The importance of mean reversion

If there is a reliable and helpful principle at works in our markets, my choice would be the ones the statisticians call “regression to the mean”. The tendency toward average profitability is a fundamental, if not the fundamental principle of competitive markets.

It can be a powerful investment tool. It can, almost by itself, select cheap portfolios and avoid expensive ones.

  • Simplicity

Simple approaches. Albert Einstein said that “… most of the fundamental ideas of science are essentially simple and may, as a rule, be expressed in a language comprehensible to everyone“.

  • Consistency

Look at the best performing funds for the past ten years or more. Templeton, Twentieth Century Growth, Oppenheimer Special, and others. What did they have in common?

It was that whatever their investment plans were, they had the discipline and good sense to carry them out consistently.

  • And finally, value

Spend your time measuring value instead of generating information. Don’t forecast. Buy what’s cheap today.

Read Trying Too Hard (.pdf). You won’t regret it.

h/t/ The Turnkey Analyst

Read Full Post »

This letter from Howard Buffett, the highly libertarian “Old Right” United States Representative father of Warren, to anarcho-capitalist historian and economist Murray Rothbard, if real, is incredible. Buffett the Elder wrote to Rothbard that he “read that Rothbard had written a book on ‘The Panic of 1819‘” and wanted to know where he could buy a copy for his son “who is a particularly avid reader of books about panics and similar phenomena.”

Here is the letter:

Howard-Buffett-715x1024

The timing of the letter – July 31, 1962 – is interesting. The first “flash crash” occurred in May 1962, and was at the time the worst crash since 1929. Time LIFE described the 1962 “flash crash” thus:

The signs, like the rumblings of an Alpine ice pack at the time of thaw, had been heard. The glacial heights of the stock boom suddenly began to melt in a thaw of sell-off. More and more stocks went up for sale, with fewer and fewer takers at the asking price. Then suddenly, around lunchtime on Monday, May 28, the sell-off swelled to an avalanche. In one frenzied day in brokerage houses and stock exchanges across the U.S., stock values — glamor and blue-chip alike — took their sharpest drop since 1929.

Memory of the great crash, and the depression that followed, has haunted America’s subconscious. Now, after all these years, was that nightmare to happen again?

The article continues that, “although the Dow Jones Industrial Average fell almost 6 percent on that one vertiginous Monday and the market was anemic for a year afterwards, the markets as a whole, at home and abroad, did bounce back.” Good to know.

h/t: Mises.org

Read Full Post »

Robert Novy-Marx, whose The Other Side of Value paper we quoted from extensively in Quantitative Value, has produced another ripping paper called The Quality Dimension of Value Investing (.pdf). Novy-Marx argues that  value investment strategies that seek high quality stocks are “nearly as profitable as traditional value strategies based on price signals alone.”

Accounting for both dimensions by trading on combined quality and price signals yields dramatic performance improvements over traditional value strategies. Accounting for quality also yields significant performance improvements for investors trading momentum as well as value.

Novy-Marx’s The Other Side of Value paper showed that a simple quality metric, gross profits-to-assets, has roughly as much power predicting the relative performance of different stocks as tried-and-true value measures like book-to-price.

Buying profitable firms and selling unprofitable firms, where profitability is measured by the difference between a firm’s total revenues and the costs of the goods or services it sells, yields a significant gross profitability premium.

Most intriguingly, Novy-Marx finds that “the signal in gross profits-to-assets is negatively correlated with that in valuation ratios.”

High quality firms tend to trade at premium prices, so value strategies that trade on quality signals (i.e., quality strategies) hold very different stocks than value strategies that trade on price signals. Quality strategies tilt towards what would traditionally be considered growth stocks. This makes quality strategies particularly attractive to traditional value investors, because quality strategies, in addition to delivering significant returns, provide a hedge to value exposures.

Novy-Marx argues that investors can “directly combine the quality and value signals and, in line with Graham’s basic vision, only buy high quality stocks at bargain prices. By trading on a single joint profitability and value signal, an investor can effectively capture the entirety of both premiums.

Performance of Quality, Value and Joint Strategies

(Click to enlarge).

Novy-Marx 2.1

Figure 1 shows the performance of a dollar invested in mid-1963 in T-bills, the market, and strategies that trade on the quality signal, the value signal, and the joint quality and value signal. The top panel shows long/short strategies, which are levered each month to run at market volatility (i.e., an expected ex ante volatility of 16%, with leverage based on the observed volatility of the unlevered strategy over the preceding 60 months). By the end of 2011 a dollar invested in T-bills in 1963 would have grown to $12.31. A dollar invested in the market would have grown to $84.77. A dollar invested in the quality and value strategies would have grown to $94.04 and $35.12, respectively. A dollar invested in the strategy that traded on the joint quality and value signal would have grown to more than $2,131.

The bottom panel shows the performance of the long-only strategies. While a dollar invested in the market would have grown to more than $80, a dollar invested in profitable large cap stocks would have grown to $241, a dollar invested in cheap large cap stocks would have grown to $332, and a dollar invested in cheap, profitable large cap stocks would have grown to $572.

Drawdowns to Quality, Value, and Joint strategies

(Click to enlarge).

Novy Marx 2.2

Figure 2 shows the drawdowns of the long/short strategies (top panel) and the worst cumulative under performance of the long-only strategies relative to the market, i.e., the drawdowns on the long-only strategies’ active returns (bottom panel). The top panel shows that the worst drawdowns experienced over the period by the long/short strategies run at market volatility were similar to market’s worst drawdown over the period. The joint quality and value strategy had, however, the smallest drawdowns of all the strategies considered. Its worst drawdown (48.7% in 2000) compares favorably to the worst drawdowns experienced by the market (51.6% in 2008-9, not shown), the traditional value strategy (down 59.5% by 2000), and the pure quality strategy (51.4% to 1977). Similar results hold for the worst five or ten drawdowns (average losses of 35.5% versus 41.1%, 38.9%, and 35.6% for the worst five drawdowns, and average losses of 25.8% versus 28.5%, 28.7%, and 26.5% for the worst ten drawdowns).

The bottom panel shows even more dramatic results for the long-only strategies active returns. Value stocks underperformed the market by 44% through the tech run-up over the second half of the ‘90s. Quality stocks lagged behind the market through much of the ‘70s, falling 28.1% behind by the end of the decade. Cheap, profitable stocks never lagged the market by more than 15.8%. Periods over which these stocks underperformed also tended to be followed quickly by periods of strong outperformance, yielding transient drawdowns that were sharply reversed.

Importantly, the signal in gross profitability is “extremely persistent,” and works well in the large cap universe.

Profitability strategies thus have low turnover, and can be implemented using liquid stocks with large capacities.

Novy-Marx’s basic message is that investors, in general but especially traditional value investors, leave money on the table when they ignore the quality dimension of value.

Read The Quality Dimension of Value Investing (.pdf).

Tomorrow, I show in an extract from Quantitative Value how we independently tested gross-profits-on-total-assets and found it to be highly predictive.

Read Full Post »

In a new paper, Using Maximum Drawdowns to Capture Tail Risk, my Quantitative Value co-author Wes Gray and Jack Vogel propose a new easily measurable and intuitive tail-risk measure that they call “maximum drawdown.” Maximum drawdown is the maximum peak-to-trough loss across a time series of compounded returns. From the abstract:

We look at maximum drawdowns to assess tail risks associated with market neutral strategies identified in the academic literature. Our evidence suggests that academic anomalies are not anomalous: all strategies endure large drawdowns at some point in the time series. Many of these losses would trigger margin calls and investor withdrawals, forcing an investor to liquidate.

The authors apply their maximum drawdown metric to existing studies, for example, momentum anomaly originally outlined in Jegadeesh and Titman (1993) to demonstrate why maximum drawdown adds to the analyses:

Jegadeesh and Titman claim large alphas associated with long/short momentum strategies over the 1965 to 1989 time period. What these authors fail to mention is that the long/short strategy endures a 33.81% holding period loss from July 1970 until March 1971. When we look out of sample from 1989 to 2012, there is still significant alpha associated with the long/short momentum strategy, but the strategy endures an 86.05% loss from March 2009 to September 2009. An updated momentum study reporting alpha estimates would claim victory, an investor engaged in the long/short momentum strategy would claim bankruptcy. Tail risk matters to investors and it should matter in empirical research.

Gray and Vogel examine maximum drawdowns for eleven long/short academic anomalies:

When looking at the worst drawdown in the history of the long/short return series, we find that 6 of the 11 strategies have maximum drawdowns of more than 50%. The Oscore, Momentum, and Return on Assets, endure maximum drawdowns of 83.50%, 86.05% and 84.71%, respectively! These losses would trigger immediate margin calls and liquidations from brokers. We do find that Net Stock Issuance and Composite Issuance limit maximum drawdowns, with maximum drawdowns of 29.23% and 26.27%, respectively. If a fund employed minimal leverage, a fund implementing these strategies would likely survive a broker liquidation scenario.

In addition to broker margin calls and liquidations, investment managers face liquidation threats from their investors. Liquidations occur for two primary reasons: there are information asymmetries between investors and investment managers, and 2)investors rely on past performance to ascertain expected future performance (Shleifer and Vishny (1997)). To understand the potential threat of liquidation from outside investors, we examine the performance of the S&P 500 during the maximum drawdown period and the twelve month drawdown period for each of our respective academic anomalies. In 9/11 cases, the S&P 500 has exceptional performance during the largest loss scenarios for the value-weighted long/short strategies. In the case of the Net Stock Issuance and the Composite Issuance anomaly—the long/short strategies with the most reasonable drawdowns—the S&P 500 returns 56.40% and 49.46% during the respective drawdown periods. One can conjecture that investors would find it difficult to maintain discipline to a long/short strategy when they are underperforming a broad equity index by over 75%. Stories about the benefits of “uncorrelated alpha” can only go so far.

Gray and Vogel find that maximum drawdown events are often followed by exceptional performance for the strategy examined:

One prediction from this story is that returns to long/short anomalies are high following terrible performance. We test this prediction in Table 5. We examine the returns on the 11 academic anomalies following their maximum drawdown event. We compute three-, six-, and twelve-month compound returns to the long/short strategies immediately following the worst drawdown. The evidence suggests that performance following a maximum drawdown event is exceptional. All the anomalies experience strong positive returns over three-, six-, and twelve-month periods following the drawdown event.

Read Using Maximum Drawdowns to Capture Tail Risk.

Read Full Post »

One of my favorite Benjamin Graham quotes:

Chairman: … One other question and I will desist. When you find a special situation and you decide, just for illustration, that you can buy for 10 and it is worth 30, and you take a position, and then you cannot realise it until a lot of other people  decide it is worth 30, how is that process brought about – by advertising, or what happens? (Rephrasing) What causes a cheap stock to find its value?

Graham: That is one of the mysteries of our business, and it is a mystery to me as well as to everybody else. [But] we know from experience that eventually the market catches up with value.

Benjamin Graham
Testimony to the Committee on Banking and Commerce
Sen. William Fulbright, Chairman
(11 March 1955)

Read Full Post »

From Montier’s most recent piece, Hyperinflations, Hysteria, and False Memories (.pdf) (via GMO):

In the past, I’ve admitted to macroeconomics being one of my dark, guilty pleasures. To some “value” investors this seems like heresy, as Marty Whitman¹ once wrote, “Graham and Dodd view macro factors . . . as crucial to the analysis of a corporate security. Value investors, however, believe that macro factors are irrelevant.” I am clearly a Graham and Doddite on this measure (and most others as well). I view understanding the macro backdrop (N.B. not predicting it, as Ben Graham said, “Analysis of the future should be penetrating rather than prophetic.”) as one of the core elements of risk management.

¹. Martin J. Whitman, Value Investing: A Balanced Approach, John Wiley & Sons, 1999.

Read Full Post »

Robert Prechter’s prediction of a 100-year bear market reminds of this great story told in the introduction to my 2003 copy of Philip A. Fisher’s Common Stocks and Uncommon Profits and Other Writings. Phil’s son Kenneth L. Fisher recounts a story about his father that has stuck with me since I first read it. For me, it speaks to Phil Fisher’s eclectic genius, and quirky sense of humor:

But one night in the early 1970’s, we were together in Monterey at one of the first elaborate dog-and-pony shows for technology stocks – then known as “The Monterey Conference” – put on by the American Electronics Association. At the Monterey Conference, Father exhibited another quality I never forgot. The conference announced a dinner contest. There was a card at each place setting, and each person was to write down what he or she thought the Dow Jones Industrials would do the next day, which is, of course, a silly exercise. The cards were collected. The person who came closest to the Dow’s change for the day would win a mini-color TV (which were hot new items then). The winner would be announced at lunch the next day, right after the market closed at one o’clock (Pacific time). Most folks, it turned out, did what I did – wrote down some small number, like down or up 5.57 points. I did that assuming that the market was unlikely to do anything particularly spectacular because most days it doesn’t. Now in those days, the Dow was at about 900, so 5 points was neither huge nor tiny. That night, back at the hotel room, I asked Father what he put down; and he said, “Up 30 points,” which would be more than 3 percent. I asked why. He said he had no idea at all what the market would do; and if you knew him, you knew that he never had a view of what the market would do on a given day. But he said that if he put down a number like I did and won, people would think he was just lucky – that winning at 5.57 meant beating out the guy that put down 5.5 or the other guy at 6.0. It would all be transparently seen as sheer luck. But if he won saying, “up 30 points,” people would think he knew something and was not just lucky. If he lost, which he was probable and he expected to, no one would know what number he had written down, and it would cost him nothing. Sure enough, the next day, the Dow was up 26 points, and Father won by 10 points.

When it was announced at lunch that Phil Fisher had won and how high his number was, there were discernable “Ooh” and “Ahhhh” sounds all over the few-hundred-person crowd. There was, of course, the news of the day, which attempted to explain the move; and for the rest of the conference, Father readily explained to people a rationale for why he had figured out all that news in advance, which was pure fiction and nothing but false showmanship. But I listened pretty carefully, and everyone he told all that to swallowed it hook, line, and sinker. Although he was socially ill at ease always, and insecure, I learned that day that my father was a much better showman than I had ever fathomed. And, oh, he didn’t want the mini-TV because he had no use at all for change in his personal life. So he gave it to me and I took it home and gave it to mother, and she used it for a very long time.

Common Stocks and Uncommon Profits and Other Writings is, of course, required reading for all value investors.

Read Full Post »

Abnormal Returns’ Tadas Viskanta has posted a great interview with my Quantitative Value co-author, the Turnkey Analyst Wes Gray:

AR: You write in the book that there are two arguments for value investing: “logical and empirical.” It seems like the value investing community heavily emphasizes the former as opposed to the latter. Why do you think that is?

WG: Human beings tend to favor good stories over evidence, but this can lead to problems. As Mark Twain says, “All you need is ignorance and confidence and the success is sure.”

This tendency to embrace stories might help explain why being “logical” is more heavily relied upon by investors, – good logic makes as good story. Relying on the evidence, or being “empirical,” is under appreciated because it is sometimes counterintuitive.  I’m actually a big fan of a logical story backed by empirical data. This is the essence of our book Quantitative Value. We present a compelling story on the value investment philosophy, but at each step along our journey we pepper our analysis with empirical analysis and academic rigor.

AR: You note in the book the importance of Ben Graham and how a continued application of his “simple value strategy” would still generate profits today. Have you seen the recent video about him? He seems to have been as interesting a guy as he was investor/teacher.

WG: As Toby and I conducted background research for the book, we became more and more convinced that Ben Graham was the original systematic value investor. In Quantitative Value we backtest a strategy Graham suggested in the 1976 Medical Economics Journal titled “The Simplest Way to Select Bargain Stocks.” We show that Graham’s strategy performed just as well over the past 40 years as it did in the 50 years prior to 1976. This is a remarkable “out-of-sample” test and highlights the robustness of a systematic value investment approach.

With respect to your question on the video: the recent video circulating the web reinforces our belief that Graham was an empiricist by nature and relied heavily on the scientific method to make his decisions. I also find it interesting that his discussions are so focused on the fallibility of human decision-making ability. Many of the ideas and concepts Graham mentioned regarding human behavior have been backed by behavioral finance studies written the past 20 years. He was well ahead of his time.

AR: The value community loves to continue to claim Warren Buffett as a disciple. However today he would be best described as a “quality and price” investor more than anything. What is the relevance of how Warren Buffett’s approach to investing has changed over time?

WG: The irony here is that, on average, Warren Buffett’s “new” approach to value investing is inferior to the approach originally described by Ben Graham. Buffett describes an approach that is broader in perspective and allows an investor to move along the cheapness axis to capture high quality firms. Graham, who studied the actual data, was much more focused on absolute cheapness. This concept is highlighted in many of his recommended investment approaches, where the foundation of the strategy prescribed is to simply purchase stocks under a specific price point (e.g., P/E <10).

After studying data from the post-Graham era, we have come to the same conclusion as Graham: cheapness is everything; quality is a nice-to-have. For example, the risk-adjusted returns on the higher-priced, but very high quality firms (i.e., Buffett firms) are much worse on a risk-adjusted basis than the returns on a basket of the cheapest firms that are of extreme low quality (i.e., Graham cigar butts). In the end, if you aren’t exclusively digging in the bargain bin, you’re missing out on potential outperformance.

Read the rest of the interview here. As Tadas says, the answers are illuminating.

For more on Quantitative Value, read my overview here.

Read Full Post »

Last week I wrote about the performance of one of Benjamin Graham’s simple quantitative strategies over the 37 years he since he described it (Examining Benjamin Graham’s Record: Skill Or Luck?). In the original article Graham proposed two broad approaches, the second of which we examine in Quantitative Value: A Practitioner’s Guide to Automating Intelligent Investment and Eliminating Behavioral Errors. The first approach Graham detailed in the original 1934 edition of Security Analysis (my favorite edition)—“net current asset value”:

My first, more limited, technique confines itself to the purchase of common stocks at less than their working-capital value, or net-current asset value, giving no weight to the plant and other fixed assets, and deducting all liabilities in full from the current assets. We used this approach extensively in managing investment funds, and over a 30-odd year period we must have earned an average of some 20 per cent per year from this source. For a while, however, after the mid-1950’s, this brand of buying opportunity became very scarce because of the pervasive bull market. But it has returned in quantity since the 1973–74 decline. In January 1976 we counted over 300 such issues in the Standard & Poor’s Stock Guide—about 10 per cent of the total. I consider it a foolproof method of systematic investment—once again, not on the basis of individual results but in terms of the expectable group outcome.

In 2010 I examined the performance of Graham’s net current asset value strategy with Sunil Mohanty and Jeffrey Oxman of the University of St. Thomas. The resulting paper is embedded below:

While Graham found this strategy was “almost unfailingly dependable and satisfactory,” it was “severely limited in its application” because the stocks were too small and infrequently available. This is still the case today. There are several other problems with both of Graham’s strategies. In Quantitative Value: A Practitioner’s Guide to Automating Intelligent Investment and Eliminating Behavioral Errors Wes and I discuss in detail industry and academic research into a variety of improved fundamental value investing methods, and simple quantitative value investment strategies. We independently backtest each method, and strategy, and combine the best into a sample quantitative value investment model.

The book can be ordered from Wiley FinanceAmazon, or Barnes and Noble.

[I am an Amazon Affiliate and receive a small commission for the sale of any book purchased through this site.]

Read Full Post »

Two recent articles, Was Benjamin Graham Skillful or Lucky? (WSJ), and Ben Graham’s 60-Year-Old Strategy Still Winning Big (Forbes), have thrown the spotlight back on Benjamin Graham’s investment strategy and his record. In the context of Michael Mauboussin’s new book The Success Equation, Jason Zweig asks in his WSJ Total Return column whether Graham was lucky or skillful, noting that Graham admitted he had his fair share of luck:

We tend to think of the greatest investors – say, Peter Lynch, George Soros, John Templeton, Warren Buffett, Benjamin Graham – as being mostly or entirely skillful.

Graham, of course, was the founder of security analysis as a profession, Buffett’s professor and first boss, and the author of the classic book The Intelligent Investor. He is universally regarded as one of the best investors of the 20th century.

But Graham, who outperformed the stock market by an annual average of at least 2.5 percentage points for more than two decades, coyly admitted that much of his remarkable track record may have been due to luck.

John Reese, in his Forbes’ Intelligent Investing column, notes that Graham’s Defensive Investor strategy has continued to outpace the market over the last decade:

Known as the “Father of Value Investing”—and the mentor of Warren Buffett—Graham’s investment firm posted annualized returns of about 20% from 1936 to 1956, far outpacing the 12.2% average return for the broader market over that time.

But the success of Graham’s approach goes far beyond even that lengthy period. For nearly a decade, I have been tracking a portfolio of stocks picked using my Graham-inspired Guru Strategy, which is based on the “Defensive Investor” criteria that Graham laid out in his 1949 classic, The Intelligent Investor. And, since its inception, the portfolio has returned 224.3% (13.3% annualized) vs. 43.0% (3.9% annualized) for the S&P 500.

Even with all of the fiscal cliff and European debt drama in 2012, the Graham-based portfolio has had a particularly good year. While the S&P 500 has notched a solid 13.7% gain (all performance figures through Dec. 17), the Graham portfolio is up more than twice that, gaining 28.5%.

Reese’s experiment might suggest that Graham is more skillful than lucky.

In our recently released book, Quantitative Value: A Practitioner’s Guide to Automating Intelligent Investment and Eliminating Behavioral Errors, Wes and I examine one of Graham’s simple strategies in the period after he described it to the present day. Graham gave an interview to the Financial Analysts Journal in 1976, some 40 year after the publication of Security Analysis. He was asked whether he still selected stocks by carefully studying individual issues, and responded:

I am no longer an advocate of elaborate techniques of security analysis in order to find superior value opportunities. This was a rewarding activity, say, 40 years ago, when our textbook “Graham and Dodd” was first published; but the situation has changed a great deal since then. In the old days any well-trained security analyst could do a good professional job of selecting undervalued issues through detailed studies; but in the light of the enormous amount of research now being carried on, I doubt whether in most cases such extensive efforts will generate sufficiently superior selections to justify their cost. To that very limited extent I’m on the side of the “efficient market” school of thought now generally accepted by the professors.

Instead, Graham proposed a highly simplified approach that relied for its results on the performance of the portfolio as a whole rather than on the selection of individual issues. Graham believed that such an approach “[combined] the three virtues of sound logic, simplicity of application, and an extraordinarily good performance record.”

Graham said of his simplified value investment strategy:

What’s needed is, first, a definite rule for purchasing which indicates a priori that you’re acquiring stocks for less than they’re worth. Second, you have to operate with a large enough number of stocks to make the approach effective. And finally you need a very definite guideline for selling.

What did Graham believe was the simplest way to select value stocks? He recommended that an investor create a portfolio of a minimum of 30 stocks meeting specific price-to-earnings criteria (below 10) and specific debt-to-equity criteria (below 50 percent) to give the “best odds statistically,” and then hold those stocks until they had returned 50 percent, or, if a stock hadn’t met that return objective by the “end of the second calendar year from the time of purchase, sell it regardless of price.”

Graham said that his research suggested that this formula returned approximately 15 percent per year over the preceding 50 years. He cautioned, however, that an investor should not expect 15 percent every year. The minimum period of time to determine the likely performance of the strategy was five years.

Graham’s simple strategy sounds almost too good to be true. Sure, this approach worked in the 50 years prior to 1976, but how has it performed in the age of the personal computer and the Internet, where computing power is a commodity, and access to comprehensive financial information is as close as the browser? We decided to find out. Like Graham, Wes and I used a price-to-earnings ratio cutoff of 10, and we included only stocks with a debt-to-equity ratio of less than 50 percent. We also apply his trading rules, selling a stock if it returned 50 percent or had been held in the portfolio for two years.

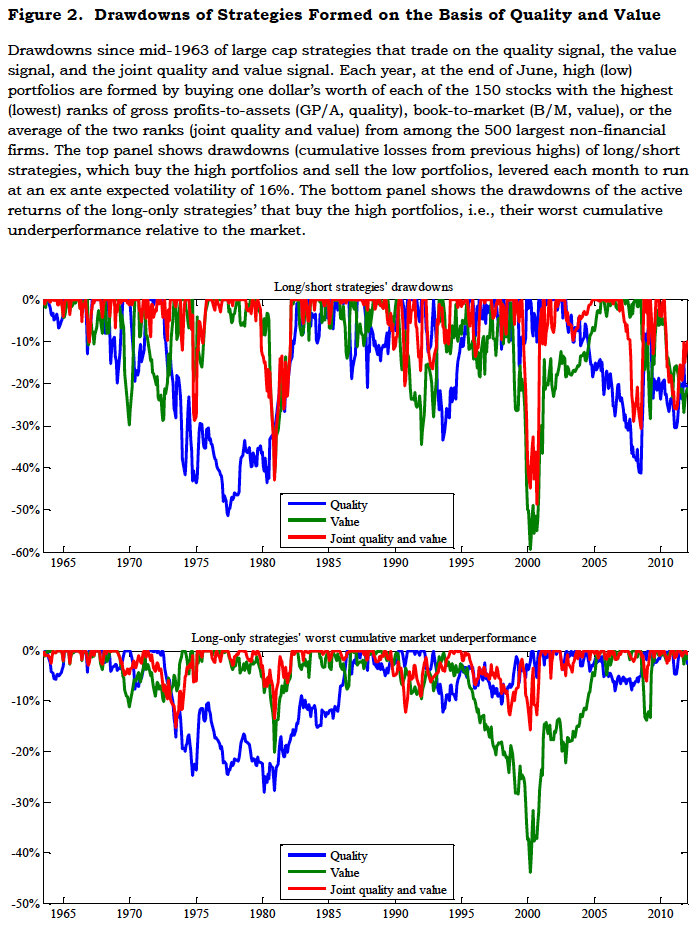
Figure 1.2 below taken from our book shows the cumulative performance of Graham’s simple value strategy plotted against the performance of the S&P 500 for the period 1976 to 2011:

Graham Strategy

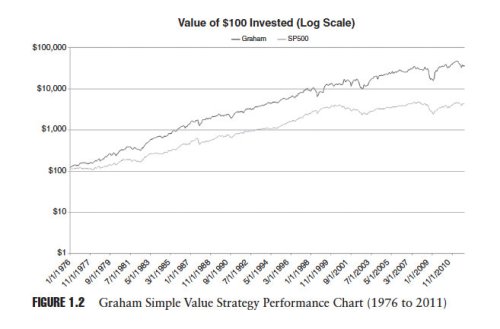
Amazingly, Graham’s simple value strategy has continued to outperform.

Table 1.2 presents the results from our study of the simple Graham value strategy:

Graham Chart

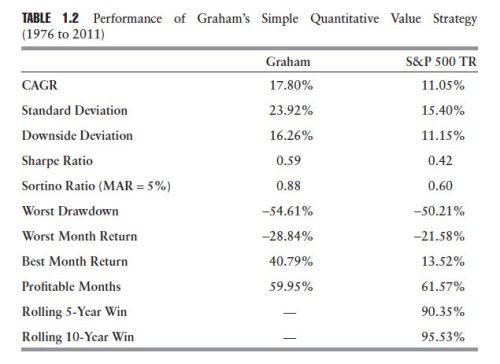
Graham’s strategy turns $100 invested on January 1, 1976, into $36,354 by December 31, 2011, which represents an average yearly compound rate of return of 17.80 percent—outperforming even Graham’s estimate of approximately 15 percent per year. This compares favorably with the performance of the S&P 500 over the same period, which would have turned $100 invested on January 1, 1976, into $4,351 by December 31, 2011, an average yearly compound rate of return of 11.05 percent. The performance of the Graham strategy is attended by very high volatility, 23.92 percent versus 15.40 percent for the total return on the S&P 500.

The evidence suggests that Graham’s simplified approach to value investment continues to outperform the market. I think it’s a reasonable argument for skill on the part of Graham.

It’s useful to consider why Graham’s simple strategy continues to outperform. At a superficial level, it’s clear that some proxy for price—like a P/E ratio below 10—combined with some proxy for quality—like a debt-to-equity ratio below 50 percent—is predictive of future returns. But is something else at work here that might provide us with a deeper understanding of the reasons for the strategy’s success? Is there some other reason for its outperformance beyond simple awareness of the strategy? We think so.

Graham’s simple value strategy has concrete rules that have been applied consistently in our study. Even through the years when the strategy underperformed the market  our study assumed that we continued to apply it, regardless of how discouraged or scared we might have felt had we actually used it during the periods when it underperformed the market. Is it possible that the very consistency of the strategy is an important reason for its success? We believe so. A value investment strategy might provide an edge, but some other element is required to fully exploit that advantage.

Warren Buffett and Charlie Munger believe that the missing ingredient is temperament. Says Buffett, “Success in investing doesn’t correlate with IQ once you’re above the level of 125. Once you have ordinary intelligence, what you need is the temperament to control the urges that get other people into trouble in investing.”

Was Graham skillful or lucky? Yes. Does the fact that he was lucky detract from his extraordinary skill? No because he purposefully concentrated on the undervalued tranch of stocks that provide asymmetric outcomes: good luck in the fortunes of his holdings helped his portfolio disproportionately on the upside, and bad luck didn’t hurt his portfolio much on the downside. That, in my opinion, is strong evidence of skill.

Buy my book The Acquirer’s Multiple: How the Billionaire Contrarians of Deep Value Beat the Market from on Kindlepaperback, and Audible.

Here’s your book for the fall if you’re on global Wall Street. Tobias Carlisle has hit a home run deep over left field. It’s an incredibly smart, dense, 213 pages on how to not lose money in the market. It’s your Autumn smart read. –Tom Keene, Bloomberg’s Editor-At-Large, Bloomberg Surveillance, September 9, 2014.

Click here if you’d like to read more on The Acquirer’s Multiple, or connect with me on Twitter, LinkedIn or Facebook. Check out the best deep value stocks in the largest 1000 names for free on the deep value stock screener at The Acquirer’s Multiple®.


Read Full Post »

« Newer Posts - Older Posts »