Charlie and I would much rather earn a lumpy 15% over time than a smooth 12%.
–Buffett, Chairman’s Letter (1996)
Can an investor concerned about a big crash use a systematic timing tool to exit the market before the crash without giving up too much return? One possible method for doing so is to use the Shiller PE as a valuation tool, and to move the portfolio into cash at some given level of overvaluation. The backtests below show the returns and drawdowns for exiting at four different levels of the Shiller PE ratio, from aggressive to conservative.
The first option is to simply always remain fully invested in the value decile (measured by price-to-book value). For our present purposes, this is the most aggressive. The three other timed strategies kick out of the value decile when the Shiller PE gets increasingly expensive. Mean, the most conservative kicks into cash when the Shiller PE gets just above its mean (17.6 for the data set). Slightly more aggressive is a strategy that kicks into cash at one standard deviation above the mean (a Shiller PE of 24.8) called 1 Std. Dev., and the next most aggressive kicks out at two standard deviations above the long-run average (a Shiller PE of 32.0) called 2 Std. Dev..
Edit: The backtests use Fama and French backtests of the book value-to-market equity (the inverse of the PB ratio) data from 1926 to 2013. As at December 2013, there were 3,175 firms in the sample. The value decile contained the 459 stocks with the highest earnings yield, and the glamour decile contained the 404 stocks with the lowest earnings yield. The average size of the glamour stocks is $7.48 billion and the value stocks $2.54 billion. (Note that the average is heavily skewed up by the biggest companies. For context, the 3,175th company has a market capitalization today of $404 million, which is smaller than the average, but still investable for most investors). Portfolios are formed on June 30 and rebalanced annually.
Performance of Value Decile (Price-to-Book Value), Cash and 3 Shiller PE Timed Strategies
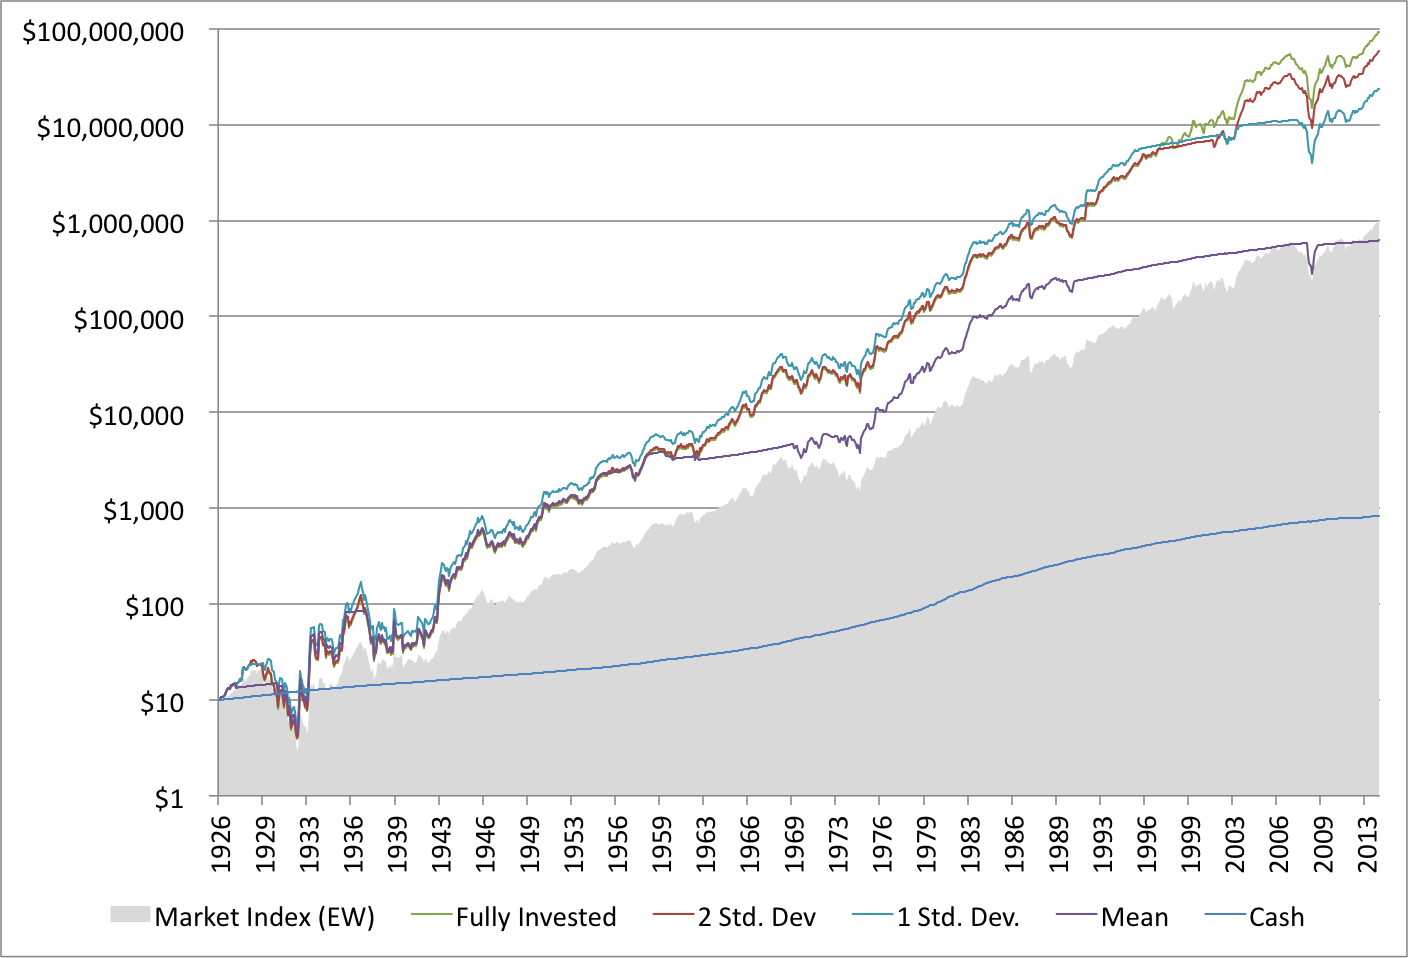
Over the period examined, the market (the equally weighted universe from which the portfolios were drawn) generated a compound average growth rate (CAGR) of 13.94 percent. Cash generated an average return of 5.17 percent over the same period. The fully invested value decile generated the best CAGR over the full period at 20.01 percent. The other strategies underperformed to the extent that they remained out of the market: The strategy that kicked into cash at the mean returned 13.4 percent yearly, the strategy that kicked into cash at one standard deviation above the mean returned 18.15 percent yearly, and the strategy that kicked into cash at two standard deviations above the mean returned 19.36 percent compound over the full period.
We expect underperformance for remaining out of the market. This is the tradeoff we make to avoid drawdowns. Is it worth it? Below we examine how much drawdown we avoid by getting out of the market at the different ratios.
Drawdowns to Value Decile (Price-to-Book Value), and 3 Shiller PE Timed Strategies

The market had a maximum drawdown in 1929 of 86 percent, and has a Sharpe ratio over the full period of of 0.13. The fully invested strategy had a maximum drawdown of 85 percent, and generated a Sharpe ratio of 0.15. The other strategies generate lower maximum drawdowns, but do so for lower Sharpe ratios: The strategy that kicked into cash at the mean had a maximum drawdown of 69 percent, and the worst Sharpe ratio at 0.11; the strategy that kicked into cash at one standard deviation above the mean had a maximum drawdown of 80 percent, and a Sharpe ratio of 0.14, and the strategy that kicked into cash at two standard deviations above the mean had a maximum drawdown of 84 percent, and a Sharpe ratio of 0.15.
Drawdowns Relative to the Market for Value Decile (Price-to-Book Value), and 3 Shiller PE Timed Strategies
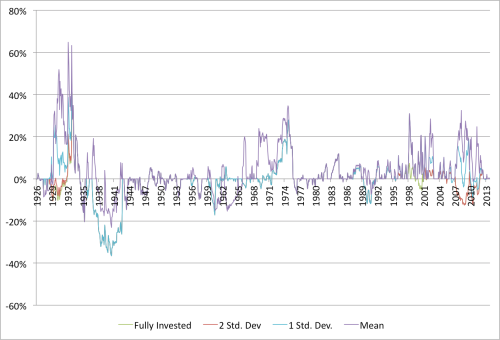
This chart examines the drawdown to each strategy relative to the market. Where it is below the midline, the strategy has drawn down further than the market, and above the midline it is outperforming.
Benjamin Graham recommended maintaining a minimum portfolio exposure to stocks of 25 percent. Below we re-run the tests, but this time instead of kicking all of the portfolio into cash, we put only 75 of the portfolio in cash, and maintain 25 percent exposure to the value decile.
Performance of Value Decile (Price-to-Book Value), Cash and 3 Shiller PE Timed Strategies (Graham Rule)
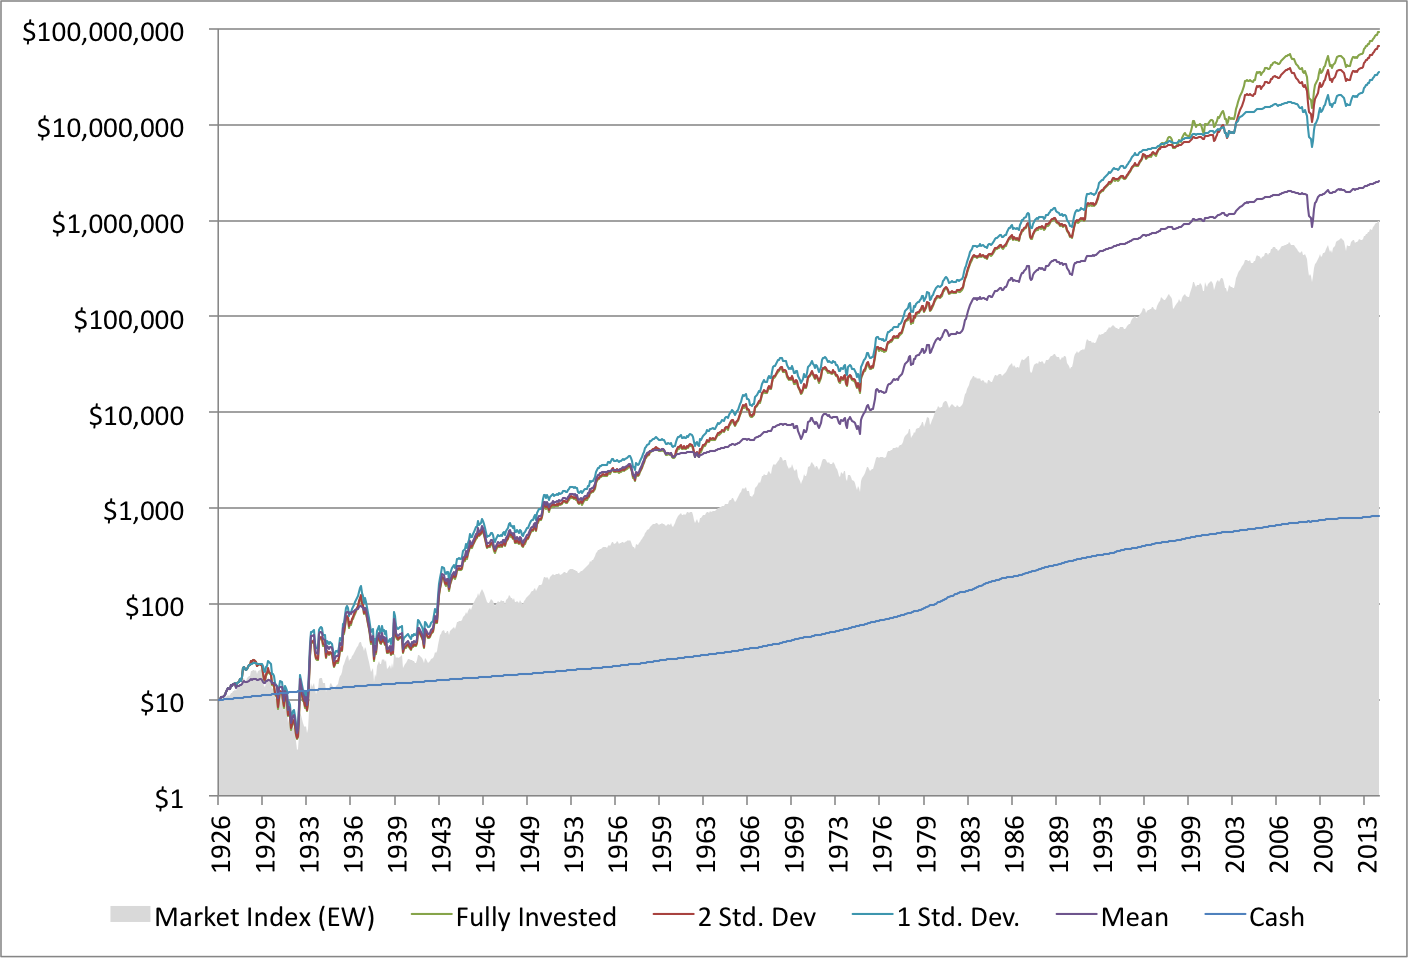
The additional exposure to the market improves the returns for the three timed strategies. The strategy that kicked into cash at the mean now returns 15.23 percent yearly, the strategy that kicked into cash at one standard deviation above the mean returned 18.67 percent yearly, and the strategy that kicked into cash at two standard deviations above the mean returned 19.55 percent compound over the full period. All still underperform the fully invested strategy at 20.01 percent.
Drawdowns to Value Decile (Price-to-Book Value), Cash and 3 Shiller PE Timed Strategies

The tradeoff for slightly improved returns is greater drawdowns and volatility. The strategy that kicked into cash at the mean had lower a maximum drawdown of 73 percent, but an improved Sharpe ratio at 0.12; the strategy that kicked into cash at one standard deviation above the mean remained unchanged with a maximum drawdown of 80 percent, and a Sharpe ratio of 0.14, and the strategy that kicked into cash at two standard deviations above the mean had a maximum drawdown of 85 percent, and a Sharpe ratio of 0.15.
Drawdowns Relative to the Market for Value Decile (Price-to-Book Value), and 3 Shiller PE Timed Strategies

The Shiller PE is not a particularly useful timing mechanism. This is because valuation is not good at timing the market (really, nothing works–timing the market is a fool’s or genius’s game). Carrying cash does serve to reduce drawdowns. It also reduces returns. The more conservative the Shiller PE ratio used, the lower the drawdown, but returns suffer, and Sharpe ratios reduce. To generate the extraordinary returns of the value deciles I’ve examined over the last few weeks, it was necessary to remain fully invested in those value stocks through thick and thin. My firm, Eyquem, offers low cost, fee-only managed accounts that implement a systematic deep value investment strategy. Please contact me by email at toby@eyquem.net or call me by telephone on (646) 535 8629 to learn more. Click here if you’d like to read more on Quantitative Value, or connect with me on Twitter, LinkedIn or Facebook.


What happens if you repeat the test using a historic mean rather than a mean looking ahead? The way the data is currently presented doesn’t seem very useful…as an investor in 1940, for example, would have no way to tell what the mean would be from 1926 – 2014, and therefore these buy / sell signals would not have been available.
LikeLike
Here it is: https://greenbackd.com/2014/07/28/worried-about-a-crash-part-2-backtests-using-shiller-pe-to-time-the-market-1926-to-2014/
LikeLike
[…] returns. Tobias Carlisle of the famous value blog Greenbackd once studied the effect of trying to time the market based on valuation indicators and showed that a fully invested portfolio outperformed portfolios […]
LikeLike
Hello, thanks for the good work. Have you tried this using Shiller’s original 30 year ratio?
LikeLike
I know I am late to the party but I am always interested in analysis associated with the Shiller CAPE. I think were this article is flawed is that it is responding to this notion of the Shiller CAPE as a binary market timing tool, meaning that at certain price points you are either 100% vested in the market or 100% in cash. This seems to be a popular way of thinking about how to use the Shiller P/E to adjust ones portfolio.
I like to look at the Shiller P/E as offering guidance regarding how vested in the market you should be. A more practical use of the Shiller P/E might be a strategy that cuts back on your stock allocation 10% for each standard deviation above the mean and adds 10% for each standard deviation below the mean. I have written some programs around this theme and a more flexible approach to using the Shiller P/E results in much better results when compared to a fully vested approach with less volatility.
The Shiller P/E could also prove valuable when adding new money to a portfolio. For instance, currently the Shiller P/E for the US market is 26+, while for the European market it is around 14. If you had 10k to add to your portfolio, which would be the better purchase?
LikeLike
Hi Tobias, I really appreciate your posts since they are in a very similar line of thinking like my own (being on a much less advanced stage and having less access
to similarly sophisticated data, though).
My questions regarding this particular post are about the definition of the “value decile”. I apologize if they might sound a little too basic:
a) What is the value decile now actually based on? Most chart titles and some parts of the text mention that it’s the decile with the stocks having the lowest PBV.
However, your edited section says “The value decile contained the 459 stocks with the highest earnings yield…”.
b) I have also read your (older) post on the Enterprise Multiple (https://greenbackd.com/2012/04/30/which-price-ratio-best-identifies-value-stocks/), which again
suggests a different definition of selecting the stocks for the “value decile”. To make it even more complicated, I was wondering myself why the good old Shiller PE
is not considered for selecting the stocks of the value decile? Since I like the simplicity and understandability of the Shiller PE/10Y CAPE: is there an obvious
advantage of selecting the stocks based on any other metric than the Shiller PE? I mean, if we are trying to time the market based on the Shiller PE, wouldn’t it
make sense to have the stocks selected on that very same criteria in the first place?
c) What is the basis for your calculation of the Shiller PE for kicking out of the value decile? Is it the Shiller PE of the value decile that we are invested in;
or is it the Shiller PE of the market?
d) Why does the value decile contain 459 stocks, whereas the glamour decile contains 404 stocks, whereas a “decile” of a universe of 3,175 stocks according to
simple math should contain 318 stocks?
Thanks,
Torben
LikeLike
Hi Tobias, I really appreciate your posts since they are in a very similar line of thinking like my own (being on a much less advanced stage and having less access to similarly sophisticated data, though).
My questions regarding this particular post are about the definition of the “value decile”. I apologize if they might sound a little too basic:
a) What is the value decile now actually based on? Most chart titles and some parts of the text mention that it’s the decile with the stocks having the lowest PBV. However, your edited section says “The value decile contained the 459 stocks with the highest earnings yield…”.
b) I have also read your (older) post on the Enterprise Multiple (https://greenbackd.com/2012/04/30/which-price-ratio-best-identifies-value-stocks/), which again suggests a different definition of selecting the stocks for the “value decile”. To make it even more complicated, I was wondering myself why the good old Shiller PE is not considered for selecting the stocks of the value decile? Since I like the simplicity and understandability of the Shiller PE/10Y CAPE: is there an obvious advantage of selecting the stocks based on any other metric than the Shiller PE? I mean, if we are trying to time the market based on the Shiller PE, wouldn’t it make sense to have the stocks selected on that very same criteria in the first place?
c) What is the basis for your calculation of the Shiller PE for kicking out of the value decile? Is it the Shiller PE of the value decile that we are invested in; or is it the Shiller PE of the market?
d) Why does the value decile contain 459 stocks, whereas the glamour decile contains 404 stocks, whereas a “decile” of a universe of 3,175 stocks according to simple math should contain 318 stocks?
Thanks so much,
Torben
LikeLike
Hi Torben,
Thank you for the kind words.
a) The value decile is the Fama French P/B value decile. I took the P/E language from an old post in error. It should have been the P/B language. Fixed now.
b) In Quantitative Value we tested longer term averages for the selection of individual stocks and found that they worked no better than the single year multiple. French doesn’t track the enterprise multiple. For studies like these I use the academic favorite, P/B.
c) The market.
d) That’s the Fama French decile definition using breakpoints, rather than a count. You can read more here.
LikeLike
re “b)”: So what you’re saying is that the Shiller PE of a single stock is no better than the “single year multiple”? What exactly is the “single year multiple” here? The Enterprise Multiple?
LikeLike
For an individual security we found the longer term multiples (from 2 years to 8 years) perform no better than the trailing twelve month (TTM) multiple. The data were noisy. There were certain averages that did generate better returns, but there was no consistency or trend to longer averages working better than shorter averages.
At a market level, the Shiller PE seems to do a better job over increasingly longer time frames. GestaltU have a good analysis here.
LikeLike
[…] « Worried about a Crash? Backtests Using Shiller PE to Time The Market (1926 to 2014) […]
LikeLike
[…] ……….. […]
LikeLike
I would like to point out a couple observations. It is a very interesting finding that going to cash (or 75% cash) can underperform buy and hold for long periods of time but it doesn’t always, or even most of the time, do so. First, in the first and fourth figures the 1 std. dev. portfolio outperforms the buy and hold portfolio until the late 1990s. It would have been a very long wait if one started investing in 1926 before buy and hold outperformed (the 2 std. dev. portfolio is nearly identical before the 1990s, presumably because valuations rarely or never reached that high before the late 1990s bubble). The second is that currently (and only slightly less so at the end of 2013) the U.S. equities market is expensive so with this as an end point one would expect buy & hold to be more likely to outperform. The beginning and end points’ valuations effect the conclusions (also, in 1926 the market was cheap). It seems like a better way of looking at this issue would be to pick a beginning and end point with average valuations (or at least the same level of valuation) so that the results aren’t biased by a change in valuation. Alternatively, it would be interesting to revisit this finding when U.S. equities return to a cheap valuation in the future.
More practically, as these findings point out, the advantage of value stocks over cash is so great that if one was to withdraw from the U.S. equities market based on the evidence (e.g. Hussman) that the current level of valuation is unlikely to produce satisfactory long-term returns the most reasonable approach is probably to invest in non-U.S. value stocks (or just form a value portfolio without regard for country, which would also limit exposure to U.S. equities).
LikeLike
All good points. The real problem with using Shiller PE if you’re a US-based value investor was revealed over the last 20 years. It would have recommended being out of the market in the late 1990s just as value stocks (measured using any metric) were about to embark upon a historically outstanding run. It’s ordinarily better to use absolute valuations of the individual securities one is buying, but that is now complicated by the fact that the “risk free” rate is now so low that any almost valuation is justifiable in a DCF. We’re in uncharted territory. I agree that one solution is a global / international portfolio. There are still some very cheap stocks outside the US. Thanks, Séamas.
LikeLike
Why does one have to be “out of the market”? Why couldn’t someone simply allocate less into the market at that time? For ex, most people save monthly, so in a high CAPE environment, allocate more to bonds or cash than in a low CAPE environment?
LikeLike
Frank,
I prefer something more absolute and fundamental than “compared to bonds.”
LikeLike
[…] Tobias Carlisle, “The Shiller PE is not a particularly useful timing mechanism.” (Greenbackd) […]
LikeLike
Interesting post. Thank you very much!
I have a proposal for a different investment approach…
*considering only the ‘best’ alternatives: ‘value decile’ (best return potential) and cash (lowest volatility/drawdowns). Valuation of the market is not considered since you are not investing in the market, only in the value decile.
*using a gradual instead of a binary portfolio allocation
*considering current valuation differential between the best alternatives instead of valuations compared to a historical anchor point (mean Shiller PE)
My proposed investment approach would be:
Definitions…
$ValueYield = Current EBIT/EV of value decile
$CashYield = Current yield of treasuries
$DeltaYield = $ValueYield – $CashYield
$PortfolioAllocation = Percentage of the portfolio invested in equal weight value decile, with the balance in cash
Portfolio allocation…
IF $DeltaYield > $UpperBoundary THEN $PortfolioAllocation = $UpperAllocation
IF $DeltaYield $LowerBoundary AND $DeltaYield < $UpperBoundary THEN $PortfolioAllocation = $DeltaYield/($UpperBoundary-$LowerBoundary)*($UpperAllocation-$LowerAllocation)
LikeLike
Excellent post, Tobias. You didn’t state how many stocks were in the “universe.” Were very small companies included? Clearly the equal weighting itself gives a value and small cap tilt to the portfolio and results in outperformance over say, the S&P 500.
LikeLike
Dennis, I’ve now updated it to include that information. The universe the stocks are drawn from is equally weighted, and includes the largest 3,175 firms.
LikeLike
Interesting studies, Tobias. We performed a similar analysis a while back, but used an expanding window and real earnings yield to determine the mean and range to avoid look-ahead bias. We also approached it from the perspective of incremental asset allocation rather than as a binary decision, which is much more in keeping with how we approach investment decisions generally. Thought you might be interested:
http://gestaltu.com/2013/01/the-full-montier-absolute-vs-relative-value.html
Keep up the super work. Cheers, Adam
LikeLike
Thanks Adam. I remember that post. I thought it was excellent.
LikeLike