The price-to-cashflow ratio (PCF) is a popular metric among value investors. Many believe that using cashflow, rather than accounting earnings, delivers a truer picture of a company’s business performance, which in turn leads to better investment performance.
Set out below are the results of two Fama and French backtests of the cashflow yield (the inverse of the PCF ratio) data from 1951 to 2013. As at December 2013, there were 2,526 firms in the sample. The value decile contained the 269 stocks with the highest earnings yield, and the glamour decile contained the 311 stocks with the lowest earnings yield. The average size of the glamour stocks is $4.74 billion and the value stocks $4.80 billion. (Note that the average is heavily skewed up by the biggest companies. For context, the 2,526th company has a market capitalization today of $272 million, which is much smaller than the average, but still investable for most investors). Stocks with negative cashflow were excluded. Portfolios are formed on June 30 and rebalanced annually.
Annual and Compound Returns (Portfolio Constituents Weighted by Market Capitalization)
In this backtest, the two portfolios are weighted by market capitalization, which means that bigger firms contribute more to the performance of the portfolio, and smaller firms contribute less. Here we can see that the value decile has comprehensively outperformed the glamour decile, returning 16.7 percent compound (18.6 percent in the average year) over the full period versus 9.3 percent for the glamour decile (11.5 percent in the average year).
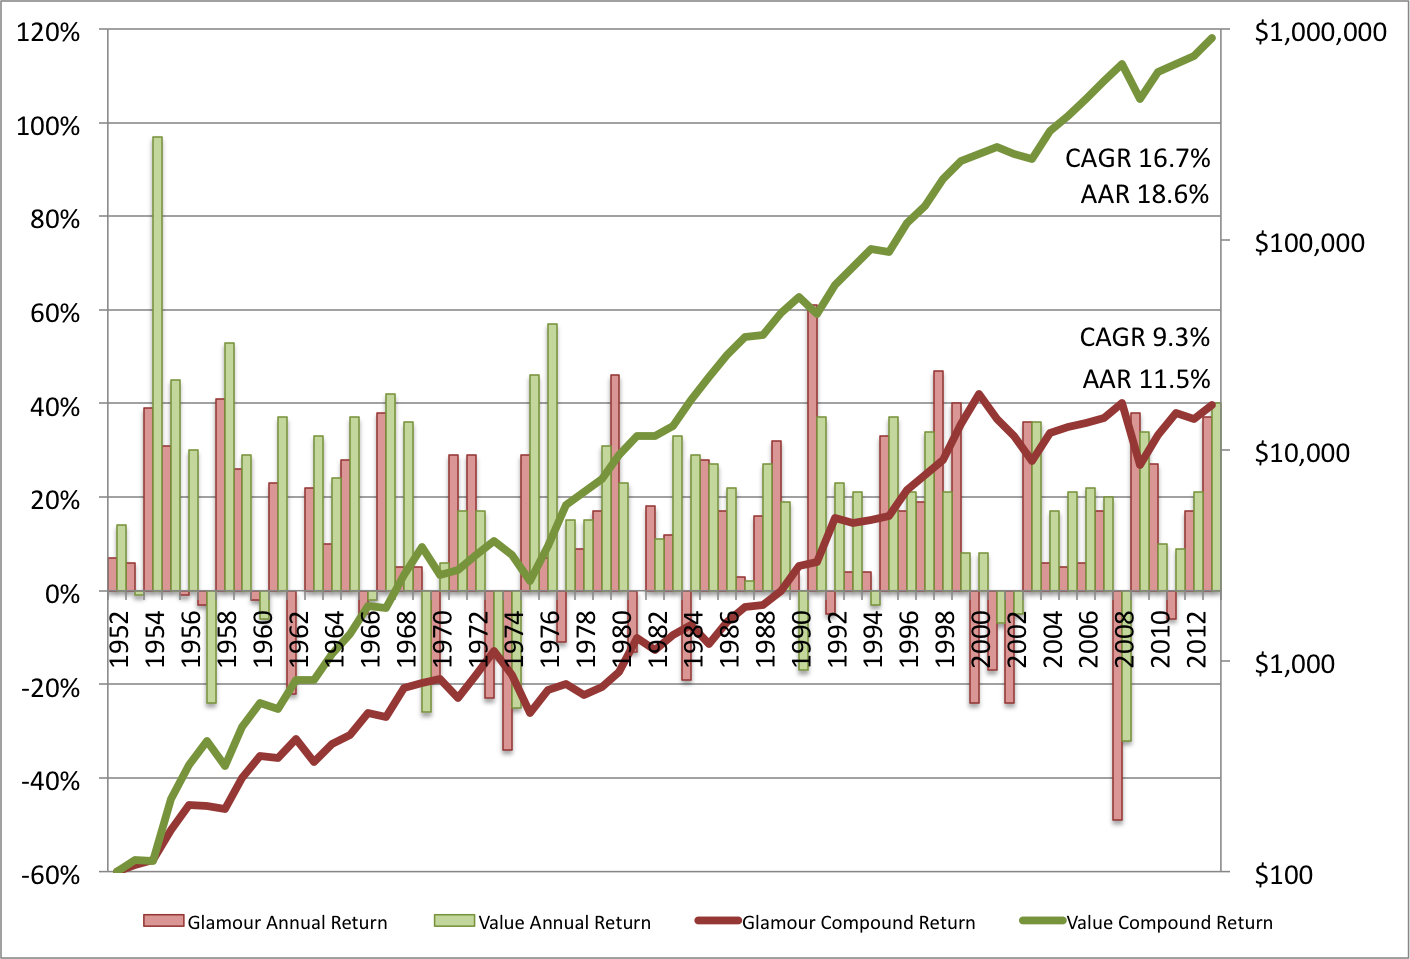
These returns are practically identical to the returns found for the price-to-earnings ratio in last week’s post (Investing Using the Price-to-Earnings Ratio and Earnings Yield (Backtests 1951 to 2013)).
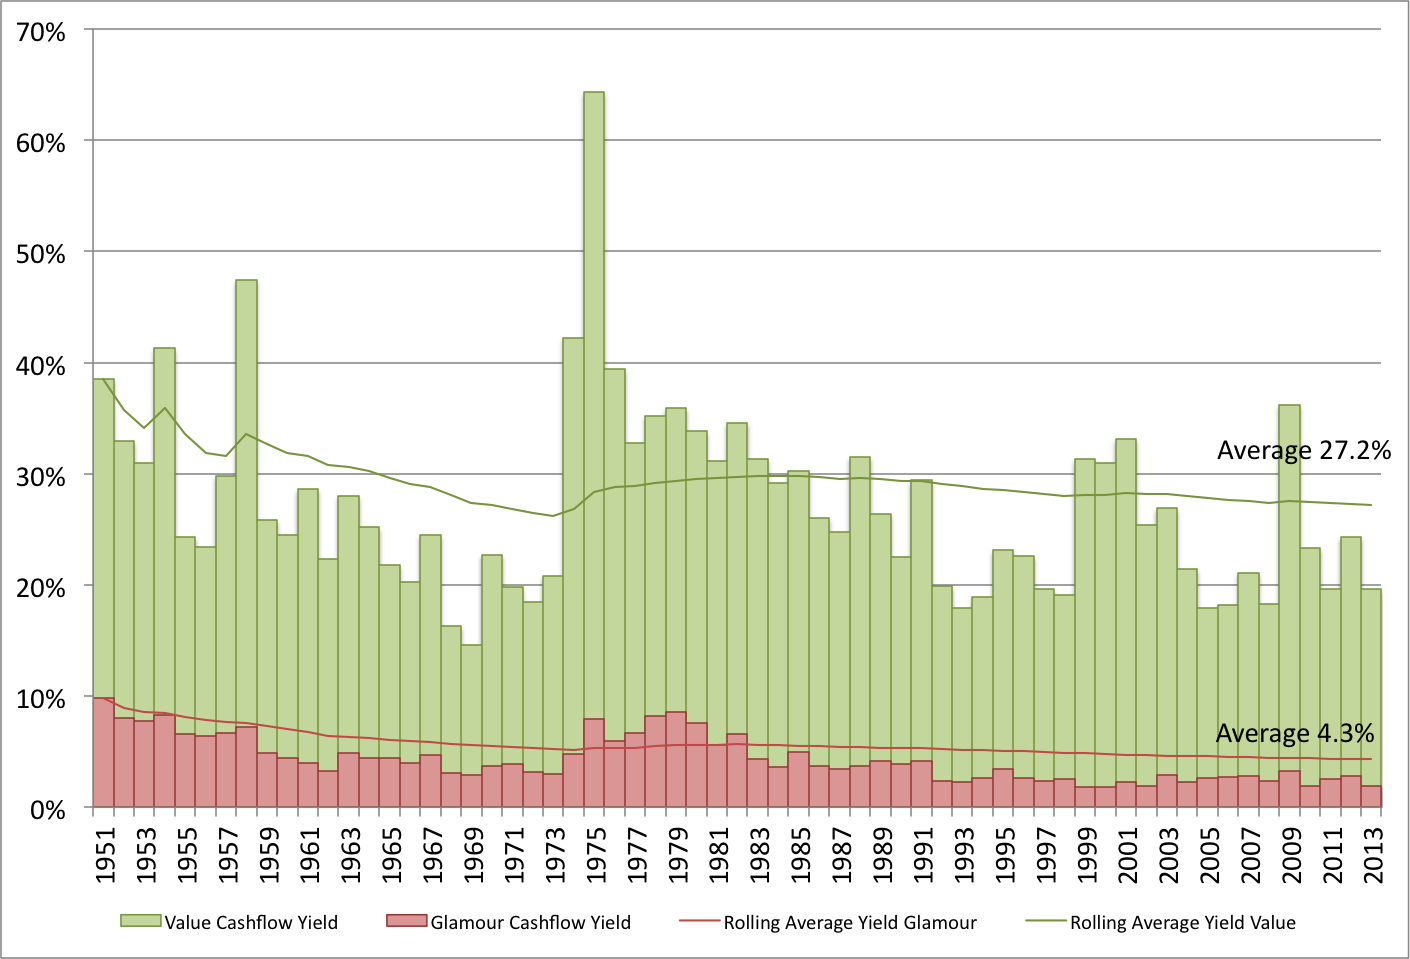
Cashflow Yield (Market Capitalization Weight)
The reason for value’s outperformance is simply due to the fact that the value portfolios generated more cashflow per dollar invested; 27.2 percent versus 4.3 percent for the glamour portfolio. (I used a rolling average this week. The “average” I’ve quoted is for the full period. The rolling average has been higher, but it’s rarely been lower.):
Recent Performance (Market Capitalization Weight)
As we saw last week, value’s outperformance over glamour is not a historical artifact. If we examine just the period since 1999, we find that, though the return is lower than the long term average, value has continued to be the better bet.
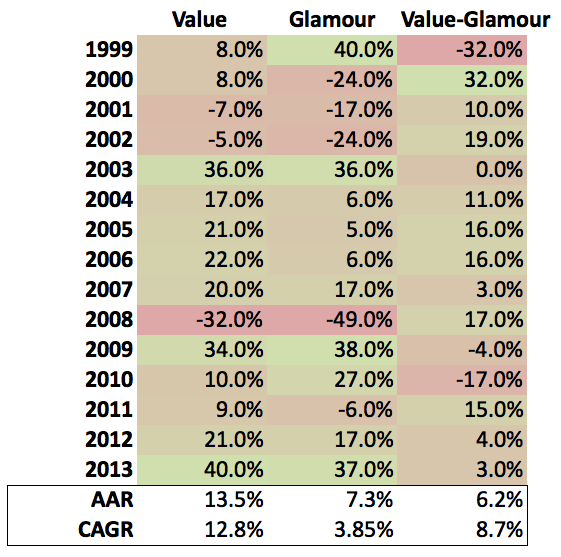
Value has continued to outperform glamour since 1999, beating it by 8.7 percent compound, and 6.2 percent in the average year. The reason for lower returns recently may be due to the popularization of simple value strategies, but I think it’s more because the market is still working off the massive overvaluation of the late 1990s Dot Com boom.
As I noted last week, market capitalization-weighted returns are useful for demonstrating that the outperformance of value over glamour is not due to the value portfolios containing smaller stocks. Unless you’re running an index (or hugging an index), they’re not really meaningful. The easiest portfolio weighting scheme is to simply equally weight each position. (If we’re prepared to put up with a little extra volatility for a little extra return, we can also Kelly weight our best ideas). Here are the equal weight return statistics for the cashflow yield.
Annual and Compound Returns (Portfolio Constituents Equally Weighted)
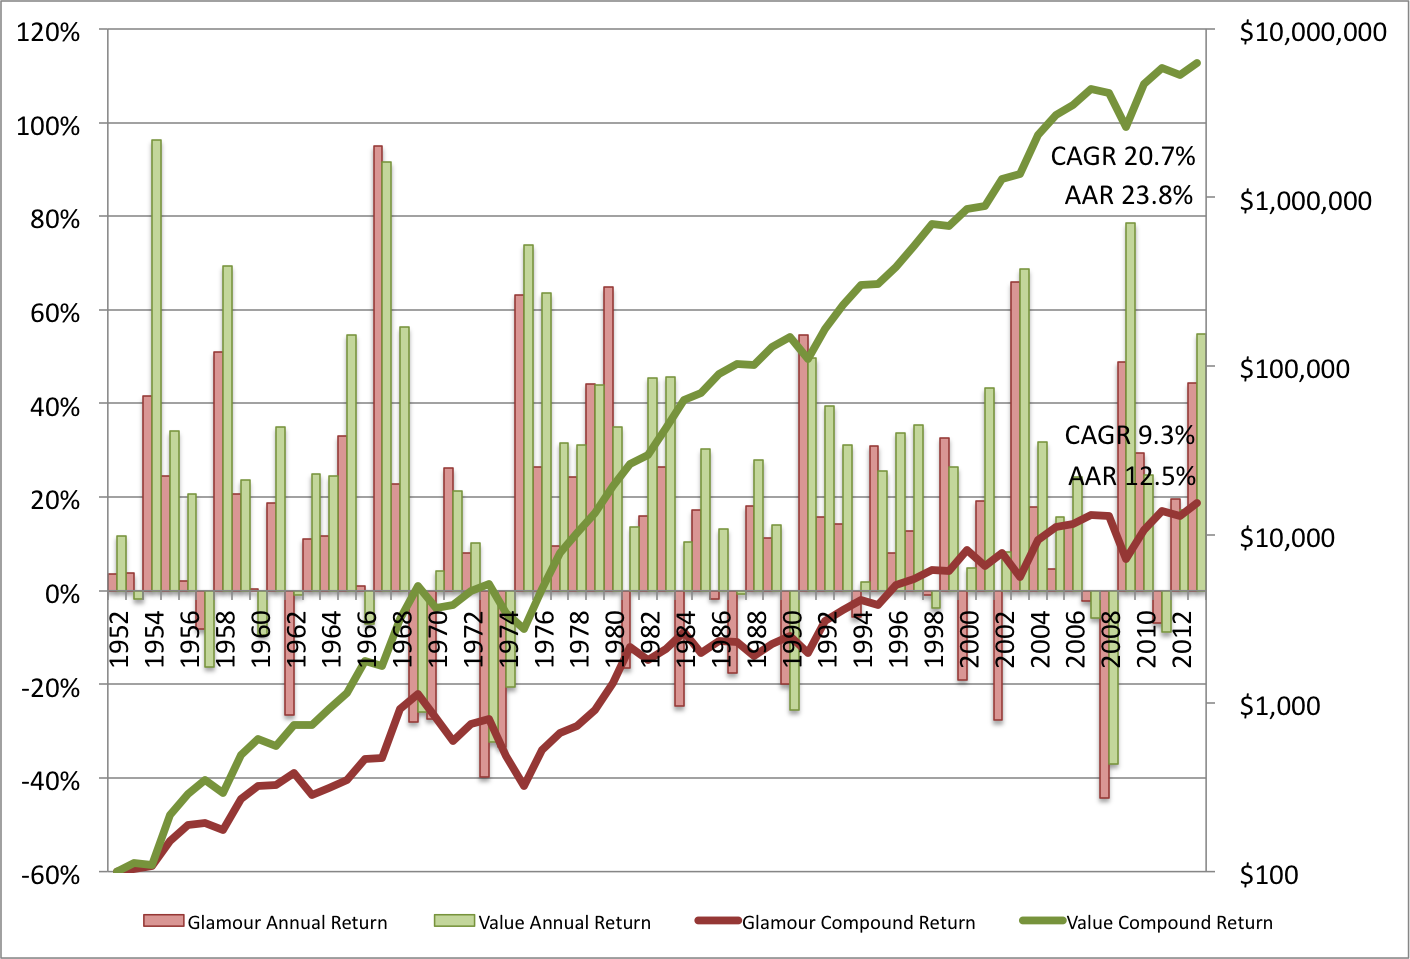
In the equal weight backtest value generated 20.7 percent compound (23.8 percent on average), beating out glamour’s 9.3 percent compound return (12.5 percent on average). Folks who saw last week’s post might note the small advantage for the cashflow yield’s value decile over the earnings yield’s value decile, 20.7 percent versus 20.1 percent. We’ll examine the significance of this small win by cashflow in the coming weeks.
Cashflow Yield (Equal Weight)
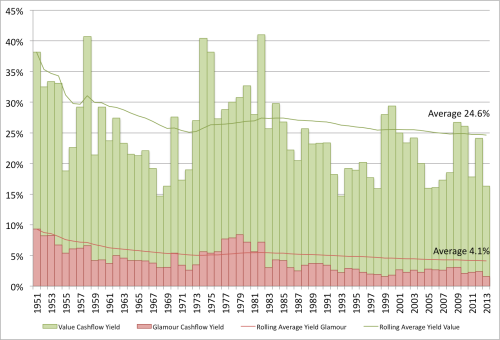
Again, the value portfolios generate more cashflow than the glamour portfolios, generating 24.6 percent on average versus 4.1 percent in the glamour portfolios. As we saw last week, the average cashflow yield for the equally weighed value portfolio is slightly lower than the average cashflow yield for the market capitalization-weighted portfolios, which indicates that, over the full period, bigger stocks tended to be a cheaper method for buying cashflow than smaller stocks. That won’t always be the case, but it’s interesting nonetheless.
Recent Performance (Equal Weight)
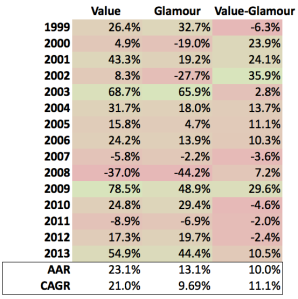
In the equal weight portfolios, value has really outperformed glamour since 1999, beating it by 11.1 percent compound, and 10.0 percent in the average year.
As we saw last week, over the long run, cheap stocks tend to outperform more expensive stocks. Like the PE ratio, the PCF ratio is a very useful metric for sorting cheap stocks from expensive stocks.
My firm, Eyquem, offers low cost, fee-only managed accounts that implement a systematic deep value investment strategy. Please contact me by email at toby@eyquem.net or call me by telephone on (646) 535 8629 to learn more.
Click here if you’d like to read more on Quantitative Value, or connect with me on LinkedIn.


[…] Investing Using Price-to-Cashflow Ratio and Cashflow Yield (Backtests 1951 to 2013) […]
LikeLike
[…] metrics like the price-to-earnings (PE) ratio, the price-to-book value (PB) ratio, and the price-to-cashflow (PCF) ratio, the dividend yield or a compound model of all excluding the dividend yield, […]
LikeLike
[…] over the last four weeks: the price-to-earnings (PE) ratio, the price-to-book value (PB) ratio, the price-to-cashflow (PCF) ratio, and the dividend […]
LikeLike
[…] Using the Price-to-Earnings Ratio and Earnings Yield (Backtests 1951 to 2013) and Investing Using Price-to-Cashflow Ratio and Cashflow Yield (Backtests 1951 to 2013)). The reason is that the earnings and cashflow backtests ran back to only 1951, and the dividend […]
LikeLike
Does the Fama and French data set include utilities and financial companies? Does it include illiquid (trading volume wise) companies?
LikeLike
Yes, the portfolios include utilities and financials. There’s no liquidity screen, but there is a minimum market capitalization, which should be investable for all but the very largest investors.
LikeLike
Can you share the minimum market cap? Is it the same one on your book?
LikeLike
[…] « Investing Using Price-to-Cashflow Ratio and Cashflow Yield (Backtests 1951 to 2013) […]
LikeLike
[…] Value works: the case for price/cash flow. (Greenbackd) […]
LikeLike
Does price to free cash flow work just as well?
LikeLike
[…] ………. […]
LikeLike
Yet another awesome post (don’t stop now!) – thanks Toby!
6 month lagged price…Asness wrote a paper somewhere (albeit the P/B ratio) showing that using current price (which *is* available to real world investors) improves results further (and argues that it is closer to ‘pure’ value).
LikeLike
In your “Annual and Compound Returns (Portfolio Constituents Equally Weighted” chart, it appears the bars representing value and glamour annual returns are reversed.
LikeLike
Good eye. Corrected now. Thanks for the heads up.
LikeLike
Looks to me like you accidentally swapped the colors in the bar chart in the background.
LikeLike
Good eye. Corrected now. Thanks for the heads up.
LikeLike
[…] Value works: the case for price/cash flow. (Greenbackd) […]
LikeLike
In this context, it’s really important to specify exactly what is meant by “cash flow”. Is it GAAP operating cash flow, some measure of FCF, and if FCF then what exactly is the definition.
Just like with P/E based measures, if definitions have changed over time, obviously that impacts results. Likewise, if a higher proportion of companies are reporting non-GAAP than further back historically, this is also an important impact (as non-GAAP undoubtedly results in higher results on avg, even though it should theoretically avg to zero over the long run).
LikeLike
“Cashflow” here is earnings before extraordinary plus deferred tax income statement plus common equity’s share of depreciation at the last fiscal year end of the prior calendar year. “Price” is market value of equity at the end of December of the prior year.
LikeLike
What happens if you use a more accepted definition of “cash flow?” That one seems pretty esoteric. Same result I assume but perhaps differing spreads?
LikeLike
That’s the Fama and French definition.
LikeLike
Toby –
First, thanks for producing a lot of excellent material on this blog. I’ve read your book as well and it changed the way I thought about portfolio construction.
Second, have you ever backtested just Cash From Operations/Enterprise Value or CFO yield? I’ve had some success with that metric combined with your favorite EBIT/EV. Just curious.
LikeLike