Feeds:
Posts
Comments

Archive for March, 2013

Renowned deep value investment firm Tweedy Browne’s recipe for deep value is simple:

The crux of the firm’s investing style comes down to buying a stock for less than its so-called intrinsic value — just plain ”value” to these veterans — a relatively simple concept introduced by Mr. Graham. As John D. Spears, 50, a third managing partner, described it, ”Value is what a business, its assets or its earning power would be worth if you or I own it and we were to sell it to a competitor down the street.”

Simple. But if figuring value is easy, why do so many value investors fall flat? ”To buy deep value takes a lot of courage, because it looks really ugly,” Christopher Browne said. ”The companies are cheap because there are a lot of bad stories out there.”

William Browne added, ”It’s like looking for the ugliest spouse because she will love you the most.”

And, real talk, am I odd for wanting to spend some time in this library?:

THE bookshelves in the conference room of Tweedy, Browne & Company are lined with financial history. Dry securities references, some of them filigreed and bound in cracked brown leather, date back to 1939.

See Investing with Tweedy, Browne and Co.

h/t Fundamental Hedgie

Read Full Post »

Wes sent through this outstanding more-than-30-year-old speech, Trying Too Hard (.pdf), which foreshadows many of the ideas we discuss in Quantitative Value, so much so that I feel that I should point out that neither Wes nor I had read it before we wrote the book. The speaker, Dean Williams, named the speech for this story:

I had just completed what I thought was some fancy footwork involving buying and selling a long list of stocks. The oldest member of Morgan’s trust committee looked down the list and said, “Do you think you might be trying too hard?” A the time I thought, “Who ever heard of trying too hard?” Well, over the years I’ve changed my mind about that. Tonight I’m going to ask you to entertain some ideas shoe theme is this: We probably are trying too hard at what we do. More than that, no matter how hard we try, we may not be as important to the results as we’d like to think we are.

The speech covers the following themes, among others:

  • Prediction

…[M]ost of us spend a lot of out time doing something that human beings just don’t do very well. Predicting things.

  • Forecasting, information, and accuracy

Confidence in a forecast rises with the amount of information that goes into it. But the accuracy of the forecast stays the same. 

  • Expertise and forecasting

And when it comes to forecasting – as opposed to doing something – a lot of expertise is no better than a little expertise. And may be even worse.

  • The importance of mean reversion

If there is a reliable and helpful principle at works in our markets, my choice would be the ones the statisticians call “regression to the mean”. The tendency toward average profitability is a fundamental, if not the fundamental principle of competitive markets.

It can be a powerful investment tool. It can, almost by itself, select cheap portfolios and avoid expensive ones.

  • Simplicity

Simple approaches. Albert Einstein said that “… most of the fundamental ideas of science are essentially simple and may, as a rule, be expressed in a language comprehensible to everyone“.

  • Consistency

Look at the best performing funds for the past ten years or more. Templeton, Twentieth Century Growth, Oppenheimer Special, and others. What did they have in common?

It was that whatever their investment plans were, they had the discipline and good sense to carry them out consistently.

  • And finally, value

Spend your time measuring value instead of generating information. Don’t forecast. Buy what’s cheap today.

Read Trying Too Hard (.pdf). You won’t regret it.

h/t/ The Turnkey Analyst

Read Full Post »

In How to Beat The Little Book That Beats The Market: Redux I showed how in Quantitative Value we tested Joel Greenblatt’s Magic Formula outlined in The Little Book That (Still) Beats the Market). We found that Greenblatt’s Magic Formula has consistently outperformed the market, and with lower relative risk than the market, but wondered if we could improve on it.

We created a generic, academic alternative to the Magic Formula that we call “Quality and Price.” Quality and Price is the academic alternative to the Magic Formula because it draws its inspiration from academic research papers. We found the idea for the quality metric in an academic paper by Robert Novy-Marx called The Other Side of Value: Good Growth and the Gross Profitability Premium. The price ratio is drawn from the early research into value investment by Eugene Fama and Ken French. The Quality and Price strategy, like the Magic Formula, seeks to differentiate between stocks on the basis of … wait for it … quality and price. The difference, however, is that Quality and Price uses academically based measures for price and quality that seek to improve on the Magic Formula’s factors, which might provide better performance.

The Magic Formula uses Greenblatt’s version of return on invested capital (ROIC) as a proxy for a stock’s quality. The higher the ROIC, the higher the stock’s quality and the higher the ranking received by the stock. Quality and Price substitutes for ROIC a quality measure we’ll call gross profitability to total assets (GPA). GPA is defined as follows:

GPA = (Revenue − Cost of Goods Sold) / Total Assets

In Quality and Price, the higher a stock’s GPA, the higher the quality of the stock. The rationale for using gross profitability, rather than any other measure of profitability like earnings or EBIT, is simple. Gross profitability is the “cleanest” measure of true economic profitability. According to Novy-Marx:

The farther down the income statement one goes, the more polluted profi tability measures become, and the less related they are to true economic profi tability. For example, a firm that has both lower production costs and higher sales than its competitors is unambiguously more profitable. Even so, it can easily have lower earnings than its competitors. If the firm is quickly increasing its sales though aggressive advertising, or commissions to its sales force, these actions can, even if optimal, reduce its bottom line income below that of its less profitable competitors. Similarly, if the firm spends on research and development to further increase its production advantage, or invests in organizational capital that will help it maintain its competitive advantage, these actions result in lower current earnings. Moreover, capital expenditures that directly increase the scale of the firm’s operations further reduce its free cash flows relative to its competitors. These facts suggest constructing the empirical proxy for productivity using gross profits.

The Magic Formula uses EBIT/TEV as its price measure to rank stocks. For Quality and Price, we substitute the classic measure in finance literature – book value-to-market capitalization (BM):

BM = Book Value / Market Price

 We use BM rather than the more familiar price-to-book value or (P/B) notation because the academic convention is to describe it as BM, and it makes it more directly comparable with the Magic Formula’s EBIT/TEV. The rationale for BM capitalization is straightforward. Eugene Fama and Ken French consider BM capitalization a superior metric because it varies less from period to period than other measures based on income:

We always emphasize that different price ratios are just different ways to scale a stock’s price with a fundamental, to extract the information in the cross-section of stock prices about expected returns. One fundamental (book value, earnings, or cashflow) is pretty much as good as another for this job, and the average return spreads produced by different ratios are similar to and, in statistical terms, indistinguishable from one another. We like [book-to-market capitalization] because the book value in the numerator is more stable over time than earnings or cashflow, which is important for keeping turnover down in a value portfolio.

Next I’ll compare show the results of our examination of Quality and Price strategy to the Magic Formula. If you can’t wait, you can always pick up a copy of Quantitative Value.

Read Full Post »

This letter from Howard Buffett, the highly libertarian “Old Right” United States Representative father of Warren, to anarcho-capitalist historian and economist Murray Rothbard, if real, is incredible. Buffett the Elder wrote to Rothbard that he “read that Rothbard had written a book on ‘The Panic of 1819‘” and wanted to know where he could buy a copy for his son “who is a particularly avid reader of books about panics and similar phenomena.”

Here is the letter:

Howard-Buffett-715x1024

The timing of the letter – July 31, 1962 – is interesting. The first “flash crash” occurred in May 1962, and was at the time the worst crash since 1929. Time LIFE described the 1962 “flash crash” thus:

The signs, like the rumblings of an Alpine ice pack at the time of thaw, had been heard. The glacial heights of the stock boom suddenly began to melt in a thaw of sell-off. More and more stocks went up for sale, with fewer and fewer takers at the asking price. Then suddenly, around lunchtime on Monday, May 28, the sell-off swelled to an avalanche. In one frenzied day in brokerage houses and stock exchanges across the U.S., stock values — glamor and blue-chip alike — took their sharpest drop since 1929.

Memory of the great crash, and the depression that followed, has haunted America’s subconscious. Now, after all these years, was that nightmare to happen again?

The article continues that, “although the Dow Jones Industrial Average fell almost 6 percent on that one vertiginous Monday and the market was anemic for a year afterwards, the markets as a whole, at home and abroad, did bounce back.” Good to know.

h/t: Mises.org

Read Full Post »

Robert Novy-Marx, whose The Other Side of Value paper we quoted from extensively in Quantitative Value, has produced another ripping paper called The Quality Dimension of Value Investing (.pdf). Novy-Marx argues that  value investment strategies that seek high quality stocks are “nearly as profitable as traditional value strategies based on price signals alone.”

Accounting for both dimensions by trading on combined quality and price signals yields dramatic performance improvements over traditional value strategies. Accounting for quality also yields significant performance improvements for investors trading momentum as well as value.

Novy-Marx’s The Other Side of Value paper showed that a simple quality metric, gross profits-to-assets, has roughly as much power predicting the relative performance of different stocks as tried-and-true value measures like book-to-price.

Buying profitable firms and selling unprofitable firms, where profitability is measured by the difference between a firm’s total revenues and the costs of the goods or services it sells, yields a significant gross profitability premium.

Most intriguingly, Novy-Marx finds that “the signal in gross profits-to-assets is negatively correlated with that in valuation ratios.”

High quality firms tend to trade at premium prices, so value strategies that trade on quality signals (i.e., quality strategies) hold very different stocks than value strategies that trade on price signals. Quality strategies tilt towards what would traditionally be considered growth stocks. This makes quality strategies particularly attractive to traditional value investors, because quality strategies, in addition to delivering significant returns, provide a hedge to value exposures.

Novy-Marx argues that investors can “directly combine the quality and value signals and, in line with Graham’s basic vision, only buy high quality stocks at bargain prices. By trading on a single joint profitability and value signal, an investor can effectively capture the entirety of both premiums.

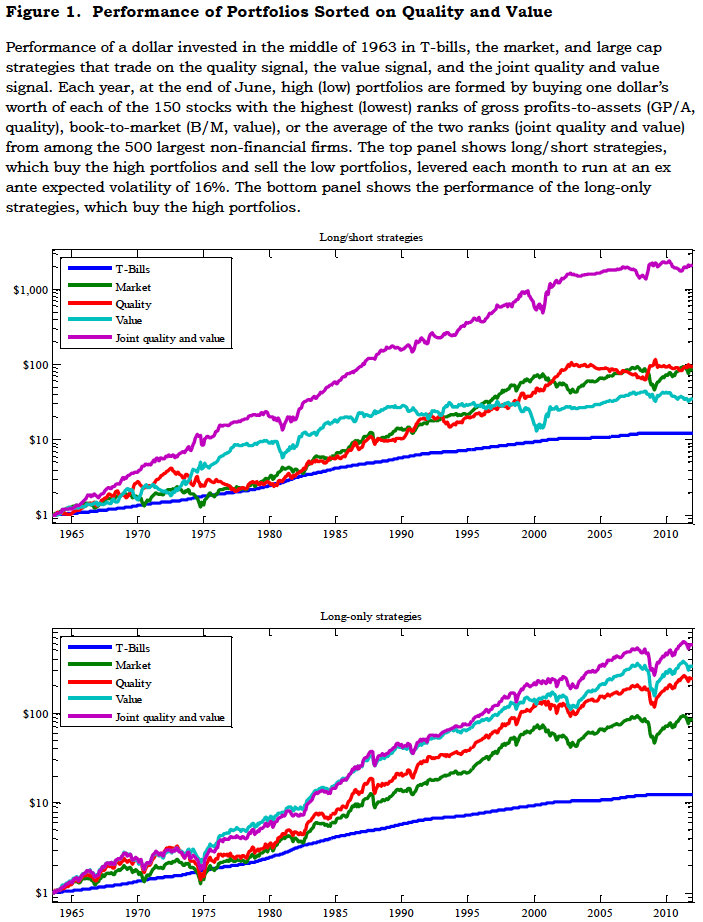
Performance of Quality, Value and Joint Strategies

(Click to enlarge).

Novy-Marx 2.1

Figure 1 shows the performance of a dollar invested in mid-1963 in T-bills, the market, and strategies that trade on the quality signal, the value signal, and the joint quality and value signal. The top panel shows long/short strategies, which are levered each month to run at market volatility (i.e., an expected ex ante volatility of 16%, with leverage based on the observed volatility of the unlevered strategy over the preceding 60 months). By the end of 2011 a dollar invested in T-bills in 1963 would have grown to $12.31. A dollar invested in the market would have grown to $84.77. A dollar invested in the quality and value strategies would have grown to $94.04 and $35.12, respectively. A dollar invested in the strategy that traded on the joint quality and value signal would have grown to more than $2,131.

The bottom panel shows the performance of the long-only strategies. While a dollar invested in the market would have grown to more than $80, a dollar invested in profitable large cap stocks would have grown to $241, a dollar invested in cheap large cap stocks would have grown to $332, and a dollar invested in cheap, profitable large cap stocks would have grown to $572.

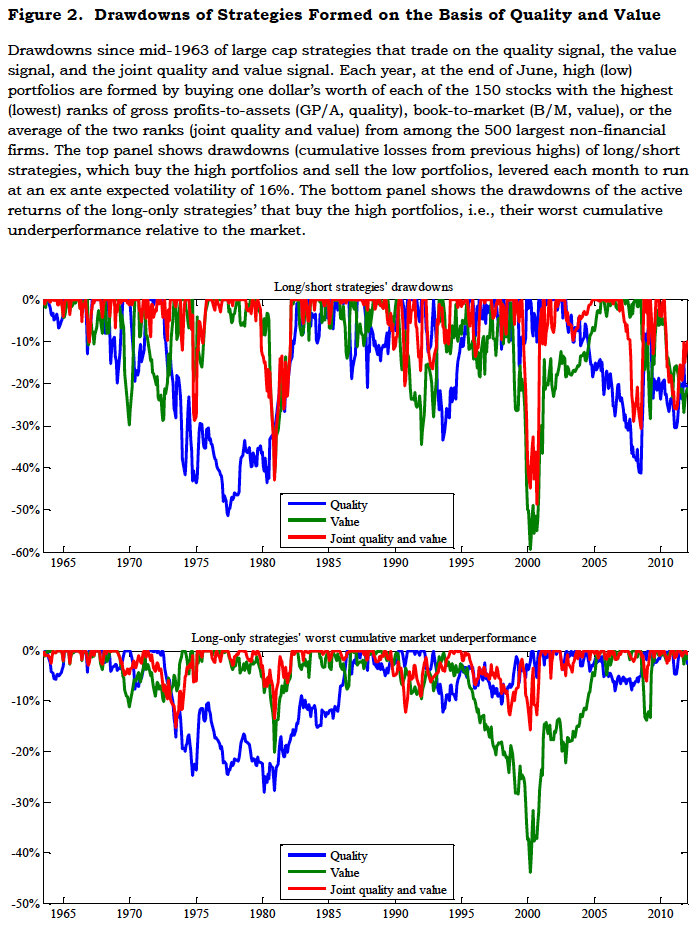
Drawdowns to Quality, Value, and Joint strategies

(Click to enlarge).

Novy Marx 2.2

Figure 2 shows the drawdowns of the long/short strategies (top panel) and the worst cumulative under performance of the long-only strategies relative to the market, i.e., the drawdowns on the long-only strategies’ active returns (bottom panel). The top panel shows that the worst drawdowns experienced over the period by the long/short strategies run at market volatility were similar to market’s worst drawdown over the period. The joint quality and value strategy had, however, the smallest drawdowns of all the strategies considered. Its worst drawdown (48.7% in 2000) compares favorably to the worst drawdowns experienced by the market (51.6% in 2008-9, not shown), the traditional value strategy (down 59.5% by 2000), and the pure quality strategy (51.4% to 1977). Similar results hold for the worst five or ten drawdowns (average losses of 35.5% versus 41.1%, 38.9%, and 35.6% for the worst five drawdowns, and average losses of 25.8% versus 28.5%, 28.7%, and 26.5% for the worst ten drawdowns).

The bottom panel shows even more dramatic results for the long-only strategies active returns. Value stocks underperformed the market by 44% through the tech run-up over the second half of the ‘90s. Quality stocks lagged behind the market through much of the ‘70s, falling 28.1% behind by the end of the decade. Cheap, profitable stocks never lagged the market by more than 15.8%. Periods over which these stocks underperformed also tended to be followed quickly by periods of strong outperformance, yielding transient drawdowns that were sharply reversed.

Importantly, the signal in gross profitability is “extremely persistent,” and works well in the large cap universe.

Profitability strategies thus have low turnover, and can be implemented using liquid stocks with large capacities.

Novy-Marx’s basic message is that investors, in general but especially traditional value investors, leave money on the table when they ignore the quality dimension of value.

Read The Quality Dimension of Value Investing (.pdf).

Tomorrow, I show in an extract from Quantitative Value how we independently tested gross-profits-on-total-assets and found it to be highly predictive.

Read Full Post »

Sponsored Content

Briefing.com has provided a fantastic spreadsheet showing a few of the changes in the portfolios of several notable presenters at this spring’s Value Investing Congress. (Click to enlarge.)

Briefing.com VIC Portfolios

The organizers expect the Congress to sell out, so intending participants are encouraged to register early. Those who sign up by Monday, March 18th will save $1,400. Go to www.ValueInvestingCongress.com/Greenbackd and use discount code is S13GB7.

Read Full Post »

In a new paper, Using Maximum Drawdowns to Capture Tail Risk, my Quantitative Value co-author Wes Gray and Jack Vogel propose a new easily measurable and intuitive tail-risk measure that they call “maximum drawdown.” Maximum drawdown is the maximum peak-to-trough loss across a time series of compounded returns. From the abstract:

We look at maximum drawdowns to assess tail risks associated with market neutral strategies identified in the academic literature. Our evidence suggests that academic anomalies are not anomalous: all strategies endure large drawdowns at some point in the time series. Many of these losses would trigger margin calls and investor withdrawals, forcing an investor to liquidate.

The authors apply their maximum drawdown metric to existing studies, for example, momentum anomaly originally outlined in Jegadeesh and Titman (1993) to demonstrate why maximum drawdown adds to the analyses:

Jegadeesh and Titman claim large alphas associated with long/short momentum strategies over the 1965 to 1989 time period. What these authors fail to mention is that the long/short strategy endures a 33.81% holding period loss from July 1970 until March 1971. When we look out of sample from 1989 to 2012, there is still significant alpha associated with the long/short momentum strategy, but the strategy endures an 86.05% loss from March 2009 to September 2009. An updated momentum study reporting alpha estimates would claim victory, an investor engaged in the long/short momentum strategy would claim bankruptcy. Tail risk matters to investors and it should matter in empirical research.

Gray and Vogel examine maximum drawdowns for eleven long/short academic anomalies:

When looking at the worst drawdown in the history of the long/short return series, we find that 6 of the 11 strategies have maximum drawdowns of more than 50%. The Oscore, Momentum, and Return on Assets, endure maximum drawdowns of 83.50%, 86.05% and 84.71%, respectively! These losses would trigger immediate margin calls and liquidations from brokers. We do find that Net Stock Issuance and Composite Issuance limit maximum drawdowns, with maximum drawdowns of 29.23% and 26.27%, respectively. If a fund employed minimal leverage, a fund implementing these strategies would likely survive a broker liquidation scenario.

In addition to broker margin calls and liquidations, investment managers face liquidation threats from their investors. Liquidations occur for two primary reasons: there are information asymmetries between investors and investment managers, and 2)investors rely on past performance to ascertain expected future performance (Shleifer and Vishny (1997)). To understand the potential threat of liquidation from outside investors, we examine the performance of the S&P 500 during the maximum drawdown period and the twelve month drawdown period for each of our respective academic anomalies. In 9/11 cases, the S&P 500 has exceptional performance during the largest loss scenarios for the value-weighted long/short strategies. In the case of the Net Stock Issuance and the Composite Issuance anomaly—the long/short strategies with the most reasonable drawdowns—the S&P 500 returns 56.40% and 49.46% during the respective drawdown periods. One can conjecture that investors would find it difficult to maintain discipline to a long/short strategy when they are underperforming a broad equity index by over 75%. Stories about the benefits of “uncorrelated alpha” can only go so far.

Gray and Vogel find that maximum drawdown events are often followed by exceptional performance for the strategy examined:

One prediction from this story is that returns to long/short anomalies are high following terrible performance. We test this prediction in Table 5. We examine the returns on the 11 academic anomalies following their maximum drawdown event. We compute three-, six-, and twelve-month compound returns to the long/short strategies immediately following the worst drawdown. The evidence suggests that performance following a maximum drawdown event is exceptional. All the anomalies experience strong positive returns over three-, six-, and twelve-month periods following the drawdown event.

Read Using Maximum Drawdowns to Capture Tail Risk.

Read Full Post »

« Newer Posts