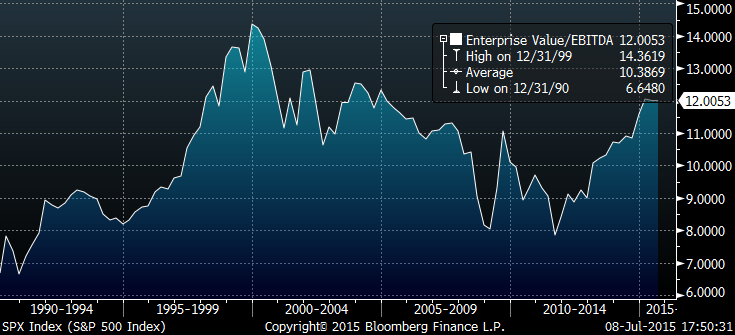
I like to check in occasionally to see where the S&P500’s average enterprise multiple stands. Right now it’s trading on just over 12x, where it’s been since the start of the year. It’s rarely been this expensive. Indeed, the average for the full period is 10.4, and it’s only exceeded this level in the late 1990s and briefly in the early-2000s.
The chart below shows enterprise value/trailing EBITDA for the S&P500 for the period 1990 to date:
The chart below shows enterprise value/trailing EBITDA for the S&P500 for the period 1990 to date compared to the S&P500:
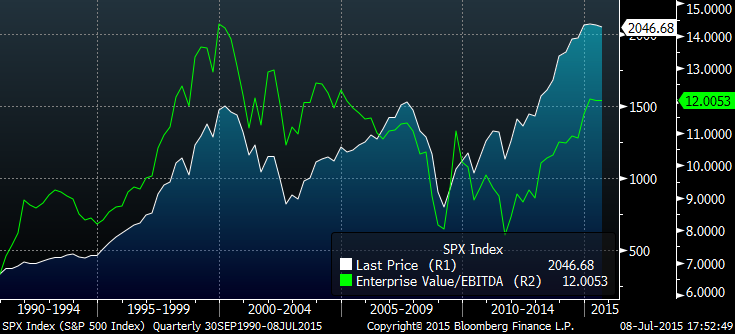
One thing clear from the charts is that the level of the S&P500’s enterprise multiple is not particularly predictive of anything. Sure, it peaked in 1999 along with the market, but it also bottomed in late 2011, while the market bottomed in early 2009.
I prefer to use it as a rough estimate of the likely upper end of valuations for my basket of stocks. While they aren’t directly comparable (the acquirer’s multiple uses enterprise value-to-operating income, not EBITDA), they are close enough. The median of the stocks in the Large Cap 1000 screener currently sits around 7.9x (the most expensive sits at 9.3x, and the cheapest at just over 5x). That’s plenty of room for bigger acquirers to pay a premium and take them out.
Buy my book The Acquirer’s Multiple: How the Billionaire Contrarians of Deep Value Beat the Market from on Kindle, paperback, and Audible.
Here’s your book for the fall if you’re on global Wall Street. Tobias Carlisle has hit a home run deep over left field. It’s an incredibly smart, dense, 213 pages on how to not lose money in the market. It’s your Autumn smart read. –Tom Keene, Bloomberg’s Editor-At-Large, Bloomberg Surveillance, September 9, 2014.
Click here if you’d like to read more on The Acquirer’s Multiple, or connect with me on Twitter, LinkedIn or Facebook. Check out the best deep value stocks in the largest 1000 names for free on the deep value stock screener at The Acquirer’s Multiple®.


Interesting read, thanks for sharing this. I am following the acquires multiple screen since Dezember 2016 monthly and calculate the median each time. That is a very small dataset so far and not much has happened. Going forward this will look interesting in the next market crash. The overall market does not matter to me as much.
Do you have data for the 30 cheapest stocks out of the 1000 universe in 2009 at the bottom? The median there should give an interesting comparison. 3? Maybe 4?
Cheers mate!
LikeLike
“One thing clear from the charts is that the level of the S&P500’s enterprise multiple is not particularly predictive of anything. Sure, it peaked in 1999 along with the market, but it also bottomed in late 2011, while the market bottomed in early 2009”
The ratio itself may not be predictive because it ignores whether earnings are at a cyclical peak. Right now this multiple is high, earnings are high, profit margins are high. On the other hand interest rates are low but they are expected to rise soon. And finally unemployment is low and labour share of income is low.
LikeLike
Yep. You might find the backtests on this thread interesting: https://greenbackd.com/?s=shiller
LikeLike