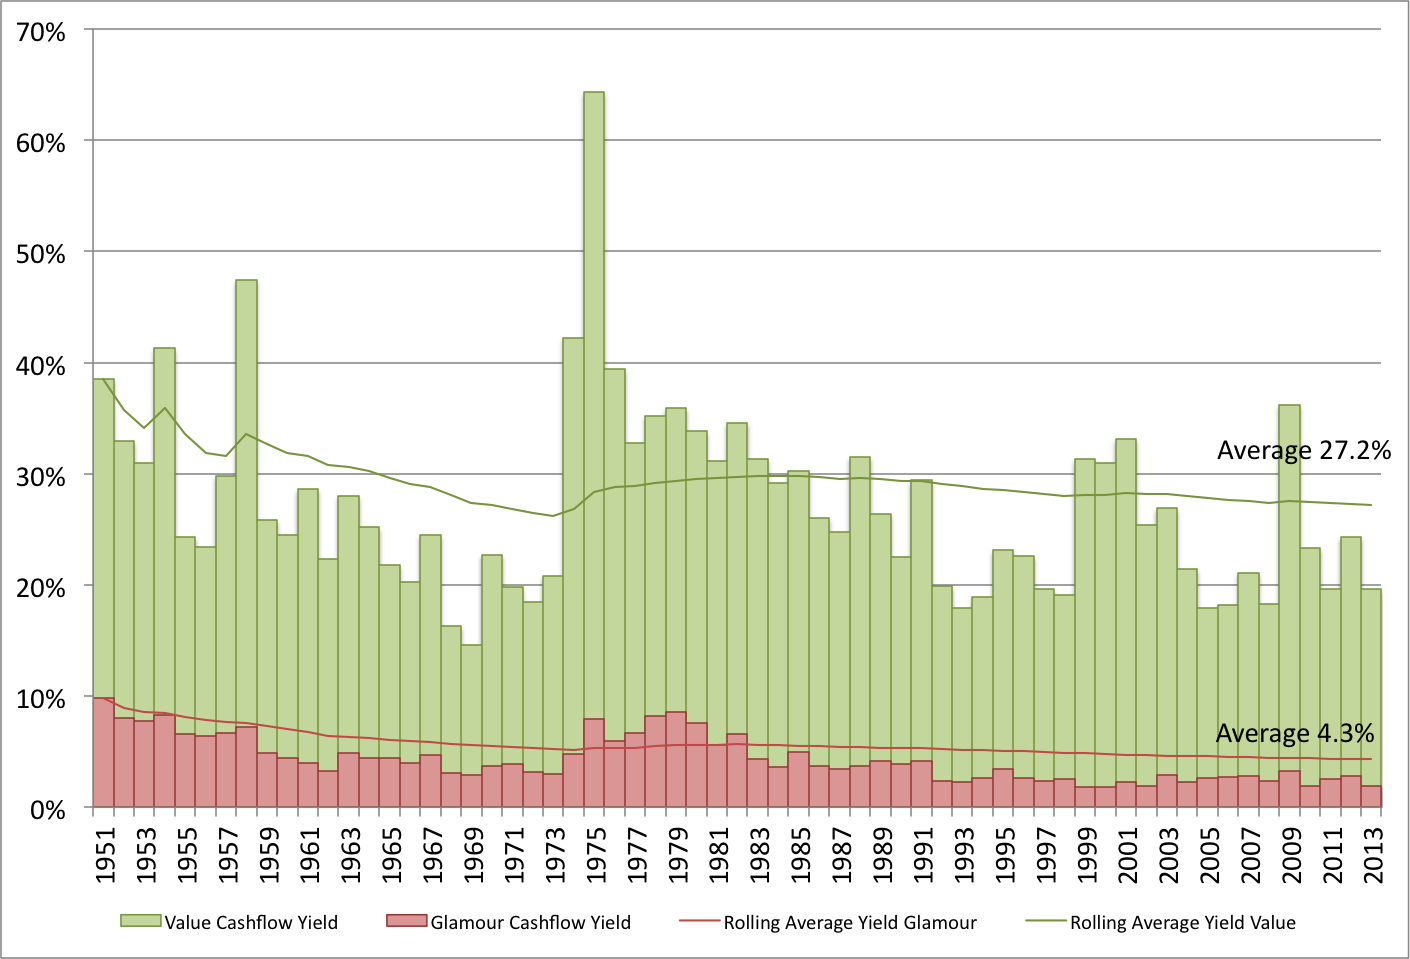
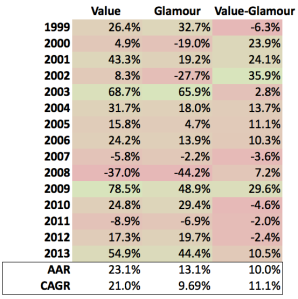
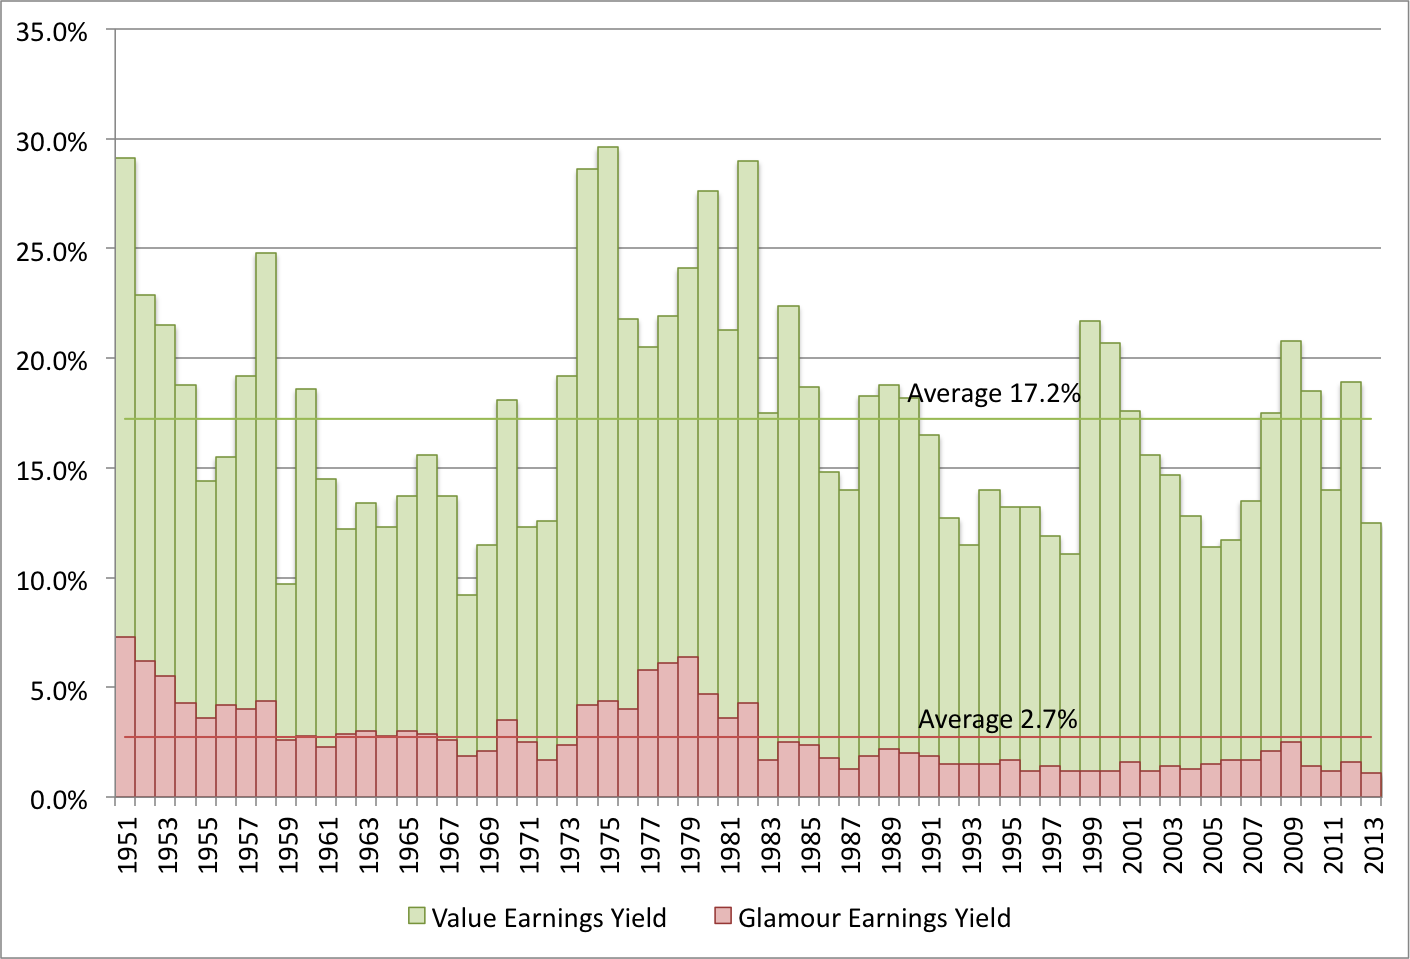
The dividend yield is a popular value metric for investors for two reasons. First, it’s the obvious metric for investors favoring income over capital gains. Second, unlike earnings or cashflow, dividends are actually paid out to shareholders, and therefore independently verifiable. Where other metrics like price-to-book value, earnings or cashflow rely on management providing a true accounting of a company’s performance, the dividend is tangible proof of excess free cash flow. Thus, goes the argument, the dividend yield therefore provides the most reliable picture of a company’s business performance, and prospects, which in turn leads to better investment performance.
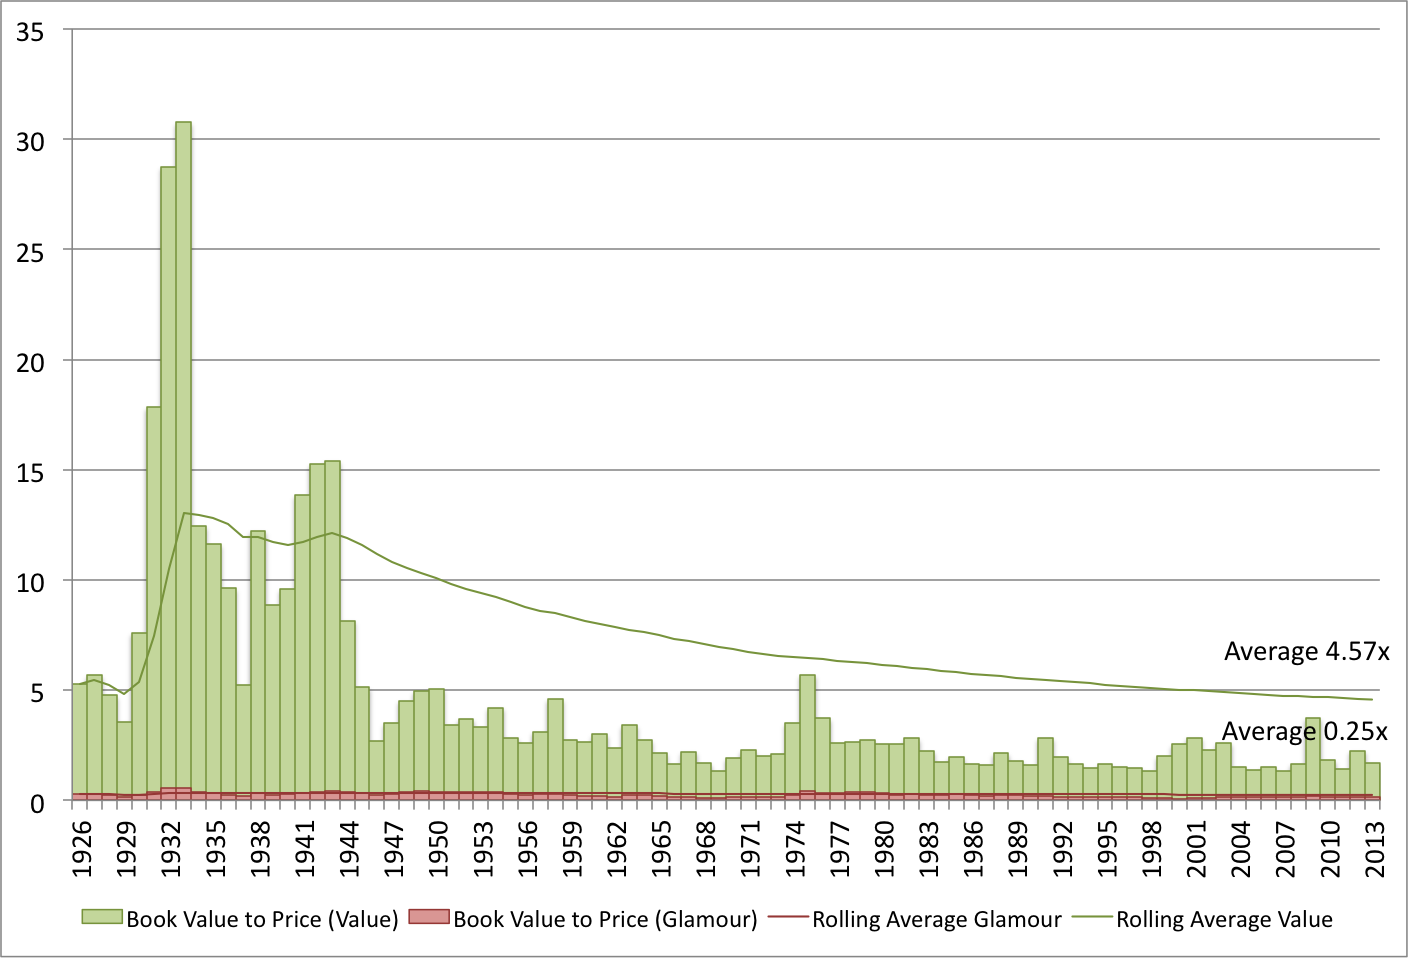
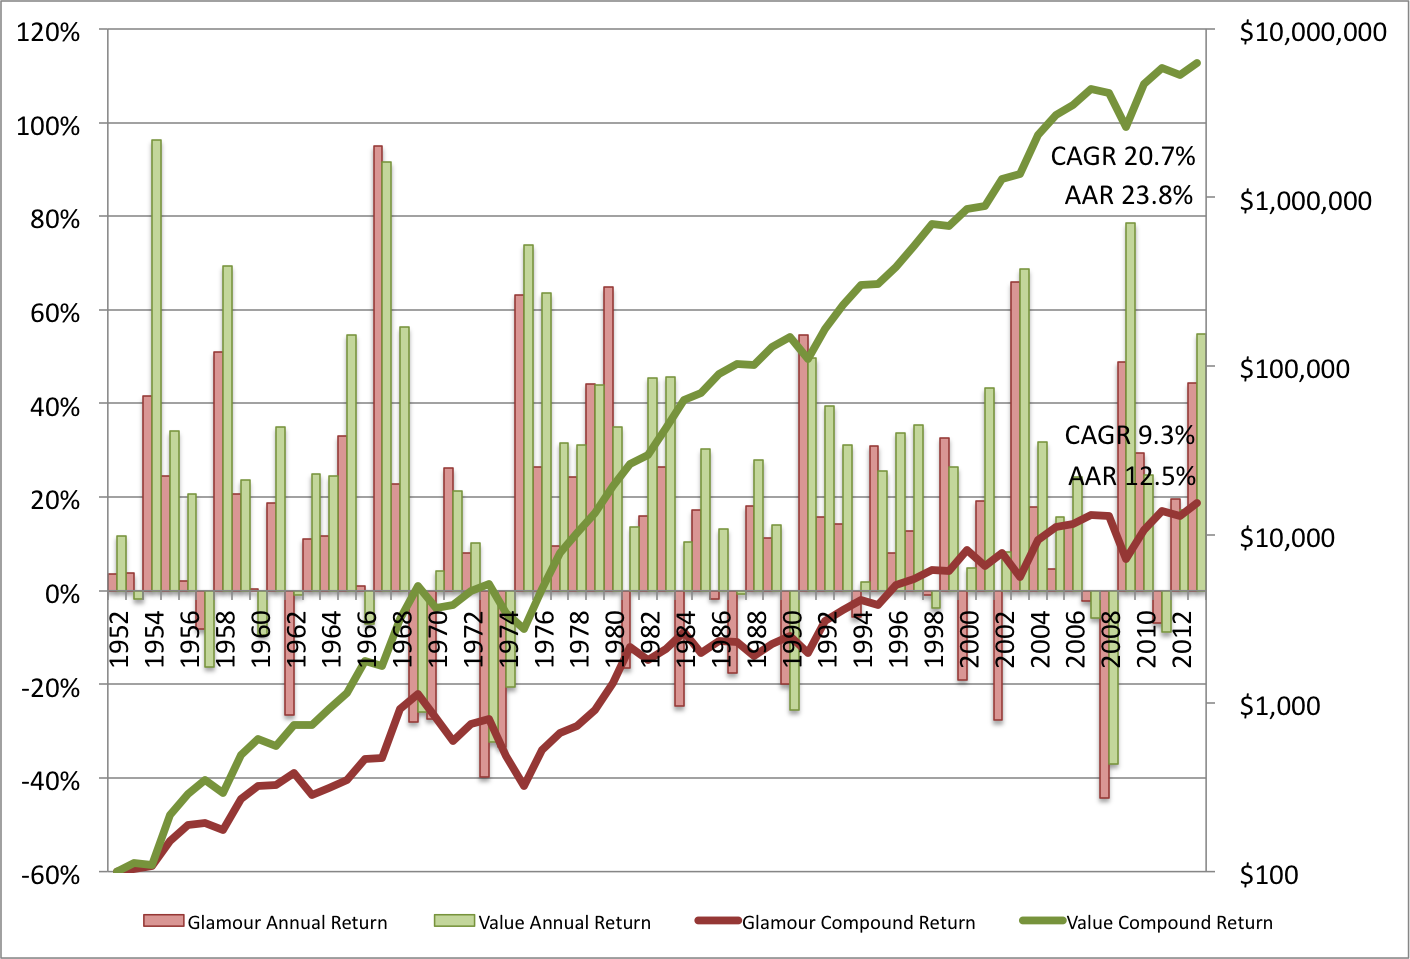
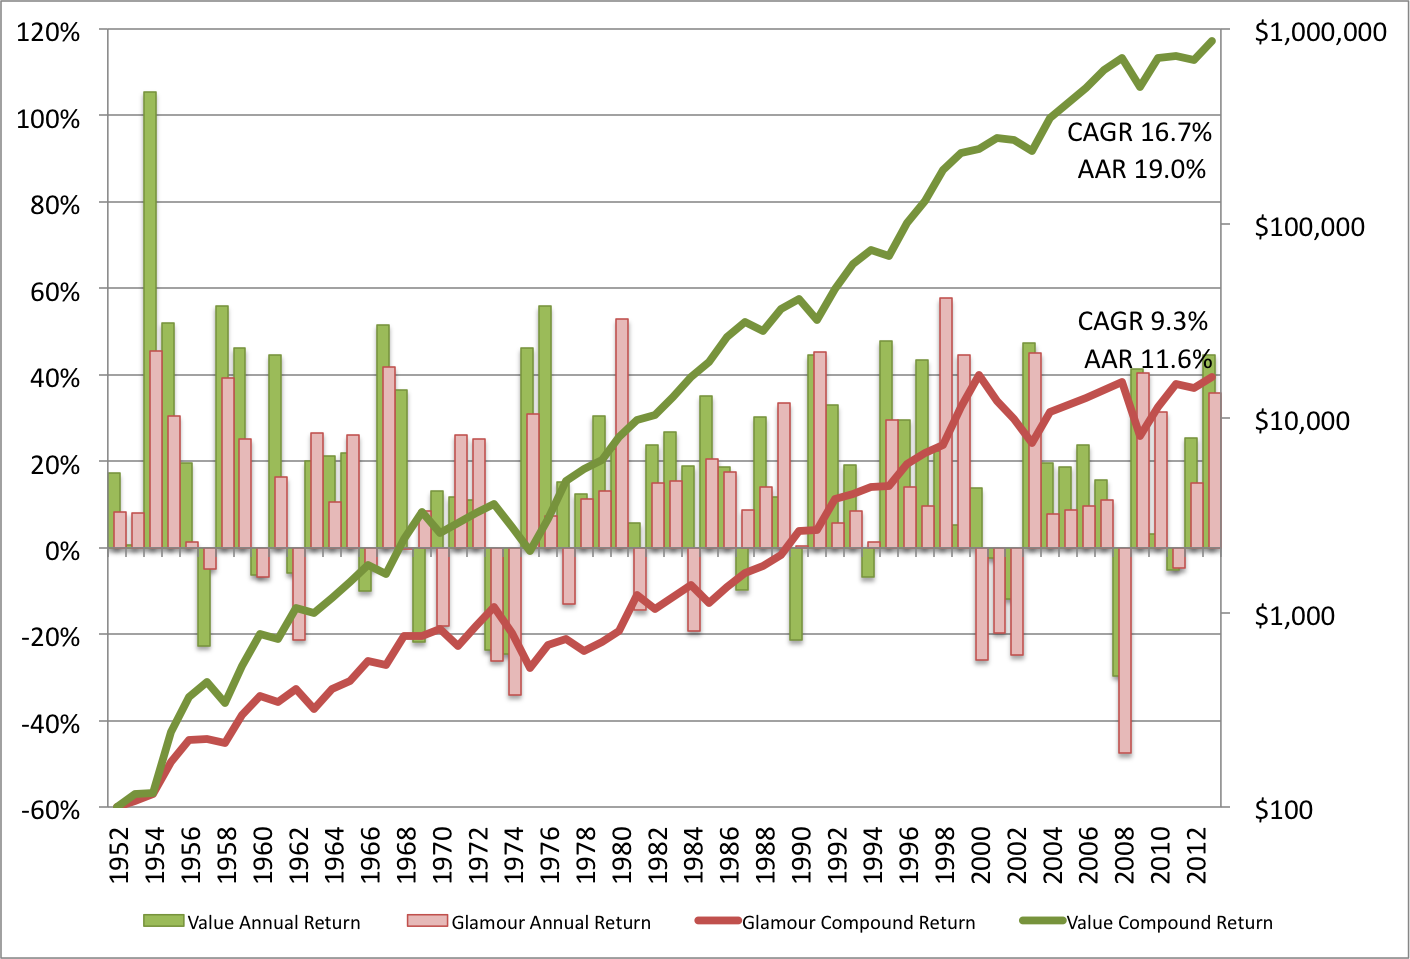
Set out below are the results of two Fama and French backtests of the dividend yield data from 1926 to 2013. As at December 2013, there were 3,393 firms in the sample. The value decile contained the 198 stocks with the highest earnings yield, and the glamour decile contained the 137 stocks with the lowest earnings yield (the deciles are smaller than 1/10th of the stocks in the sample because fully 1,894 stocks pay no dividend at all). The average size of the glamour stocks is $8.60 billion and the value stocks $3.06 billion. Portfolios are formed on June 30 and rebalanced annually.
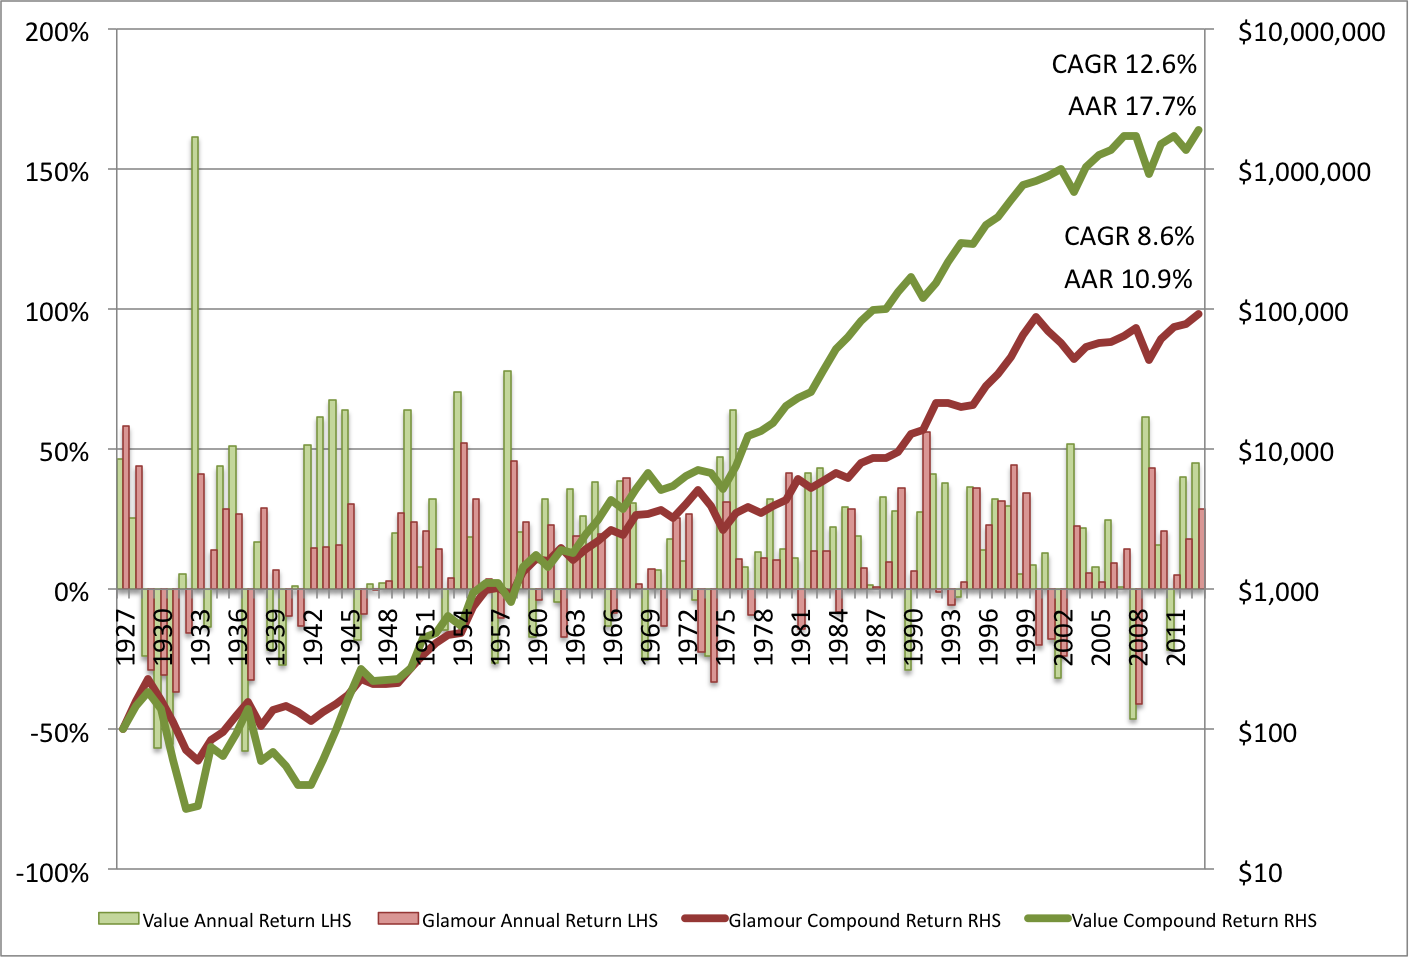
Dividend Yield Annual and Compound Returns (Portfolio Constituents Weighted by Market Capitalization)
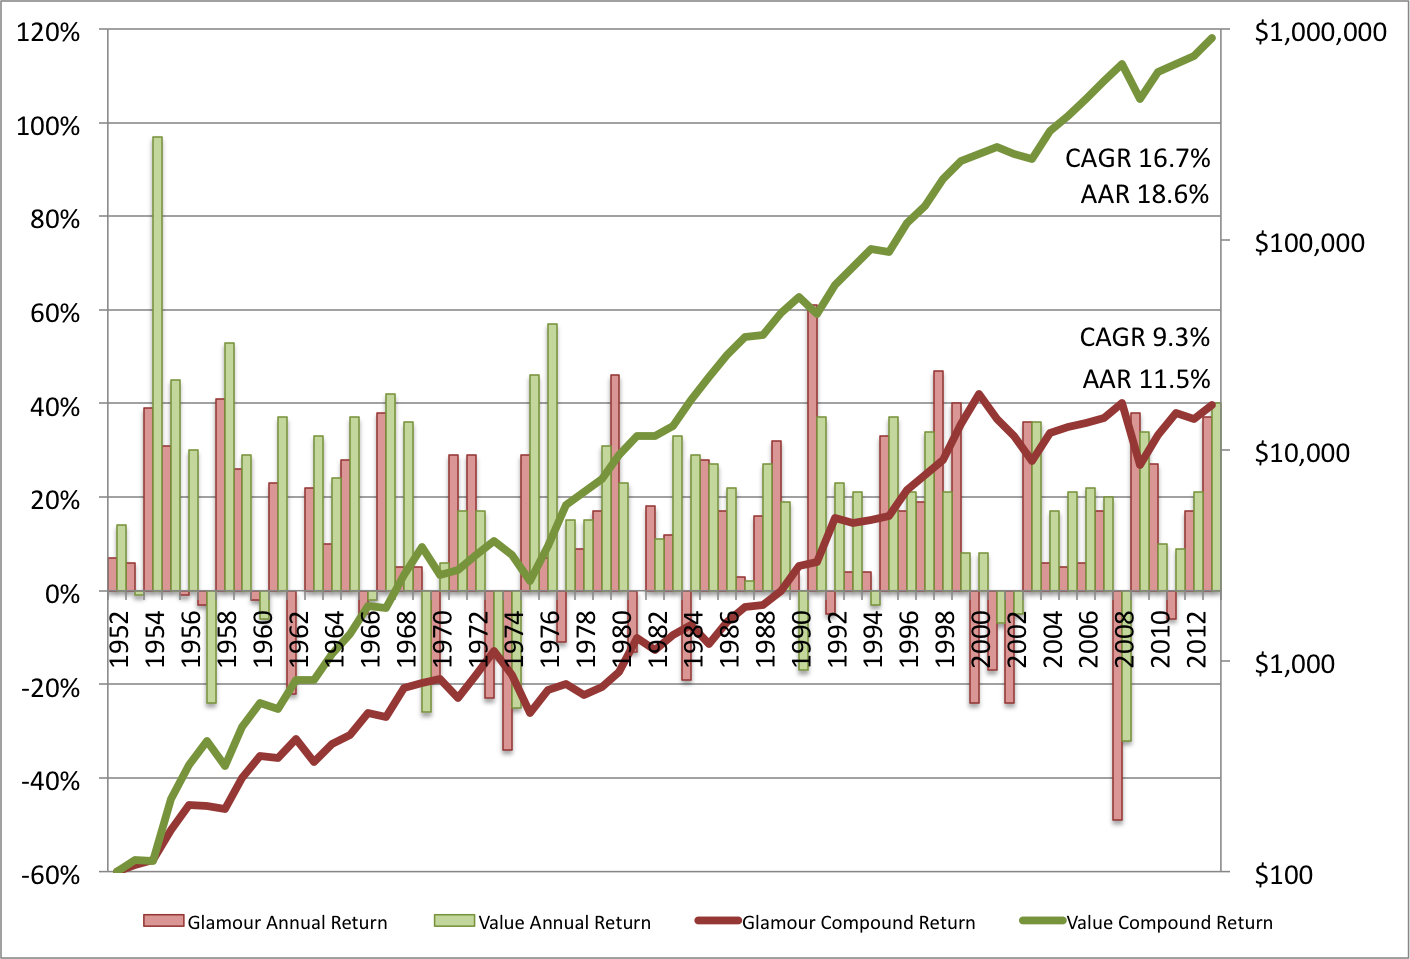
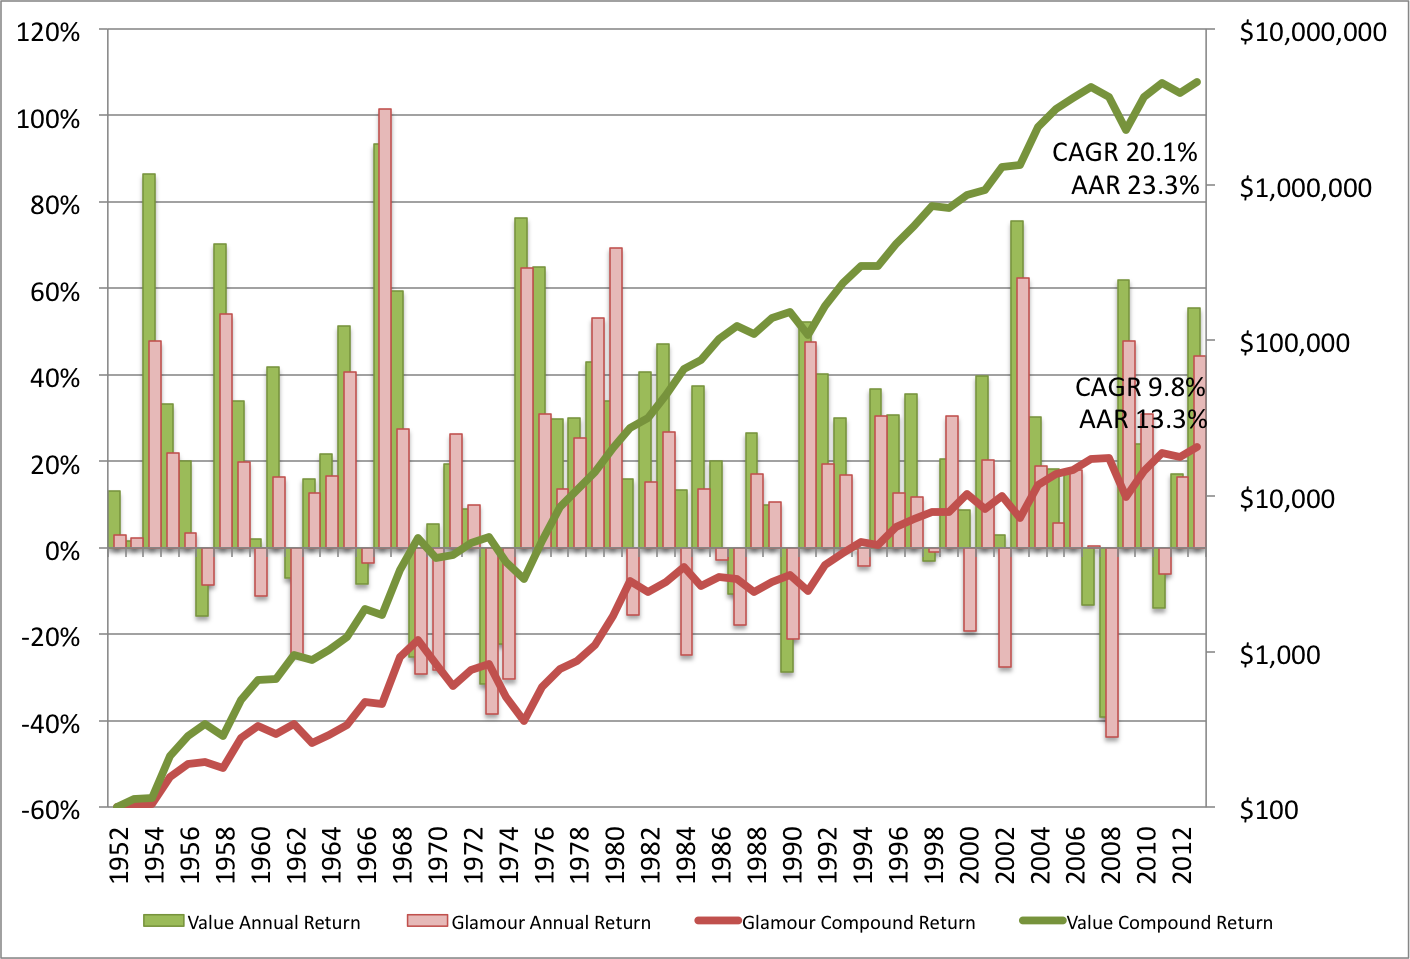
In this backtest, the two portfolios are weighted by market capitalization, which means that bigger firms contribute more to the performance of the portfolio, and smaller firms contribute less. Here we can see that the value decile has outperformed the glamour decile, returning 10.3 percent compound (13.4 percent in the average year) over the full period versus 8.3 percent for the glamour decile (11.3 percent in the average year).

These returns are considerably lower than the returns found for the price-to-earnings and cashflow ratios over the last few weeks (see Investing Using Price-to-Book Value Ratio or Book Equity-to-Market Equity Multiple (Backtests 1926 to 2013), Investing Using the Price-to-Earnings Ratio and Earnings Yield (Backtests 1951 to 2013) and Investing Using Price-to-Cashflow Ratio and Cashflow Yield (Backtests 1951 to 2013)). The reason is that the earnings and cashflow backtests ran back to only 1951, and the dividend yield data, like the book value return data last week, begins in 1926. The difference is partly due to the 1929 crash, which had an oversized impact on returns. The crash is visible on the chart, and striking–it took almost twenty years for the value decile to fully recover.
To make a comparison possible of dividend yield’s performance to the performance of book, earnings and cashflow over the same period, I also measured the returns beginning in 1951. Since 1951 the high dividend yield value decile has generated a compound annual growth rate (CAGR) of 11.4 percent and an average annual return (AAR) of 13.6 percent. Over the same period the glamour decile returned a CAGR of 9.6 percent and an AAR of 12.9 percent. These returns are still considerably lower than the returns generated by PB, PCF, and PE over the same period.
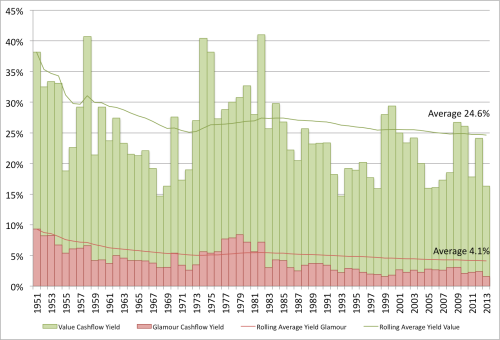
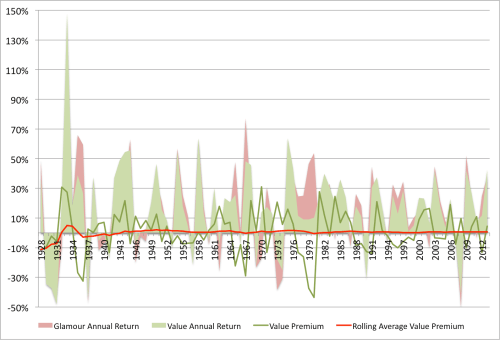
Dividend Yield Value Premium (Market Capitalization Weight)
The value premium is the outperformance of the value decile over the glamour decile. This chart shows the yearly returns to each of the value and glamour deciles, the value premium (value-glamour) in each year, and the rolling average from the start of the data in 1926:
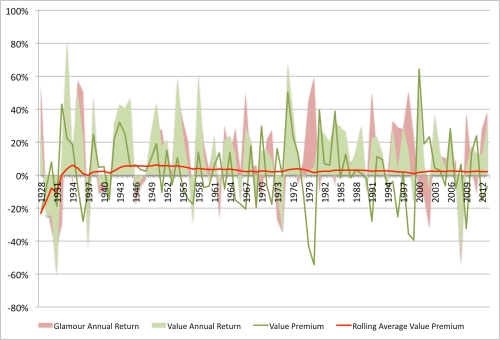
The rolling average tells a sad story for value relative to glamour: The value premium has gradually disappeared over time. Over the 73 years of data to 2000 it was actually zero, but it has slightly recovered since to be 1.8 percent compound over the full period.
Decile Performance (Market Capitalization Weight)
The following chart shows the returns to each of the deciles sorted by dividend yield (Updated to include non-dividend payers).
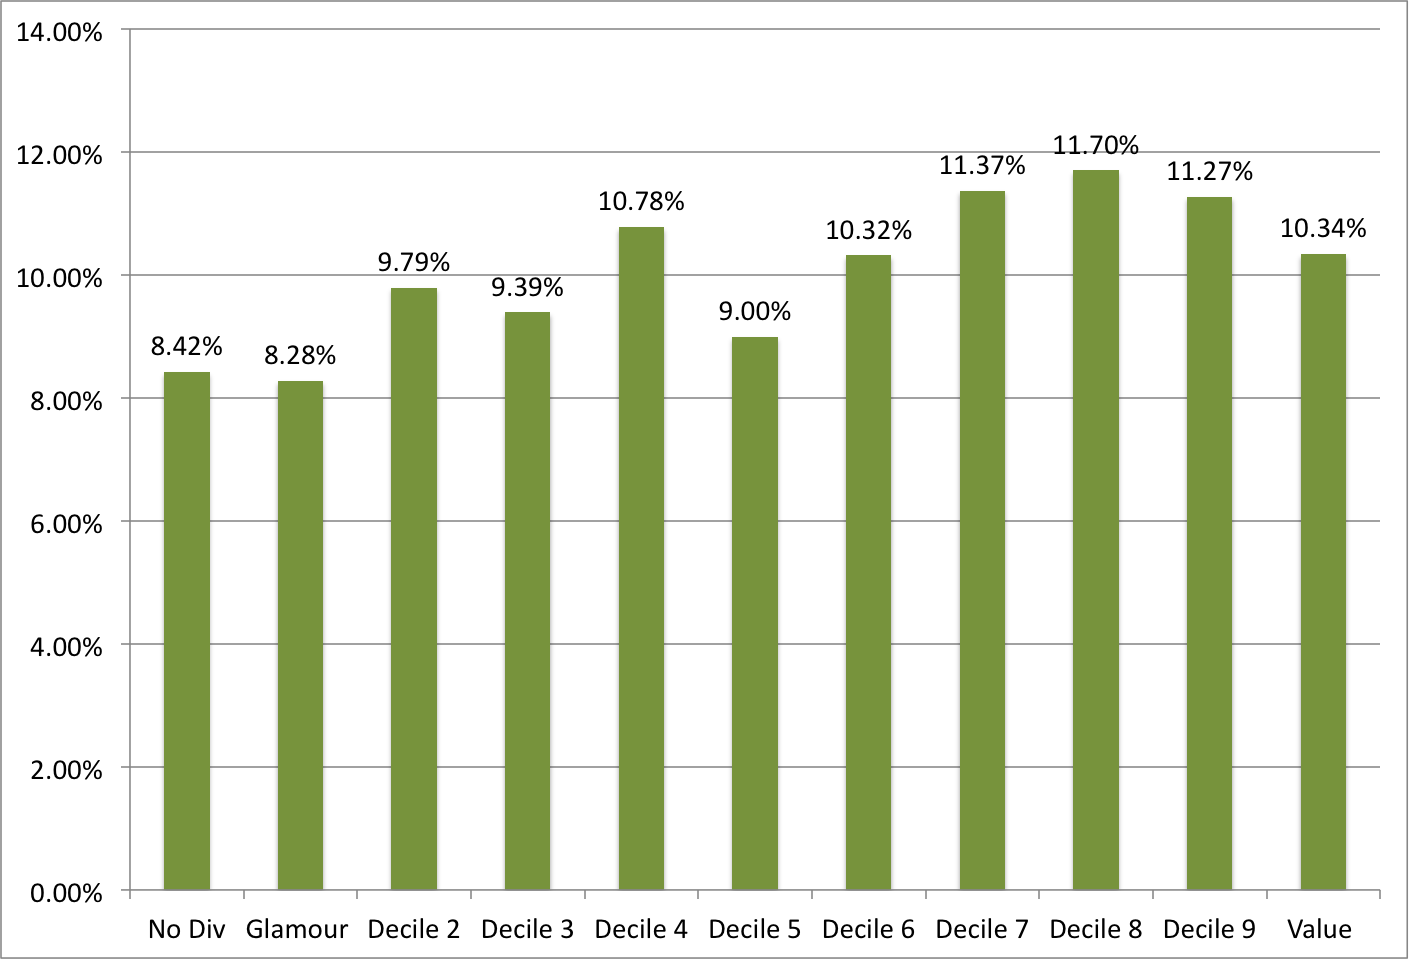
This chart shows that the dividend yield is a fair, but not great, metric for sorting stocks into value and glamour portfolios. This is due to the fact that less than half of all stocks pay dividends (only 44 percent pay dividends). A better comparison might be the dividend payers to the 1,894 stocks in the non-dividend paying cohort. The non-dividend payers (No Div) underperformed all the dividend payers except for the glamour decile, generating a compound annual growth rate (CAGR) of 8.4 percent and average annual return (AAR) of 13.2 percent over the full period (and, since 1951, a CAGR of 9.0 percent and an AAR of 13.5 percent).
Recent Performance (Market Capitalization Weight)
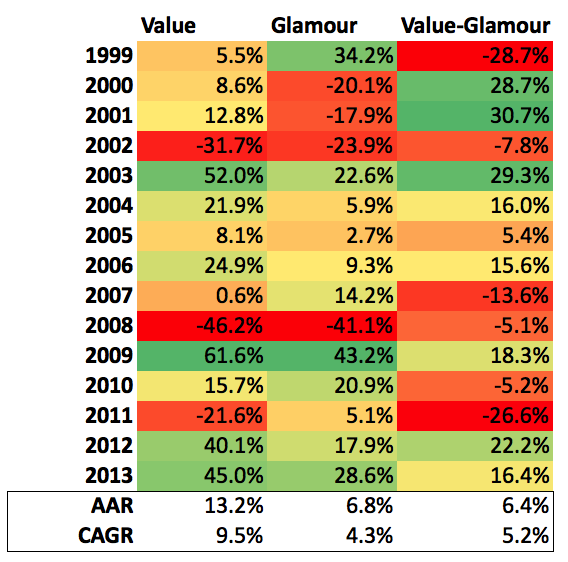
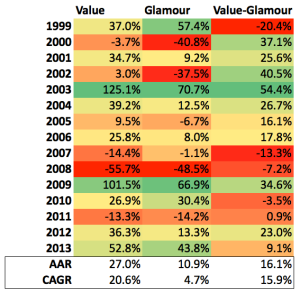
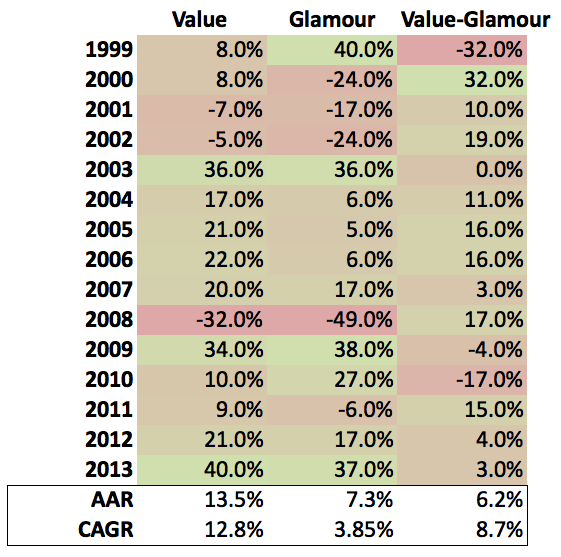
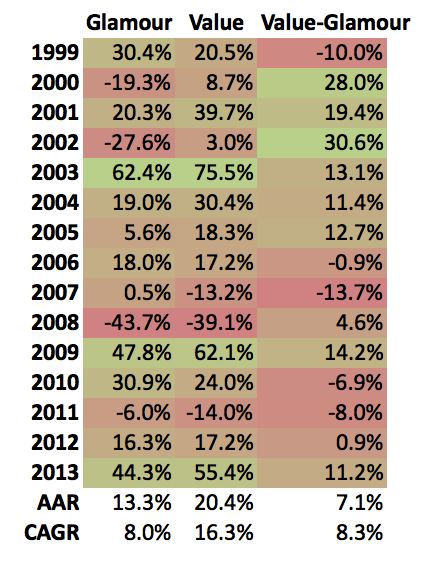
As we’ve seen over the last few weeks, value’s outperformance over glamour is not a historical artifact. If we examine just the period since 1999, we find that value has been the better bet.
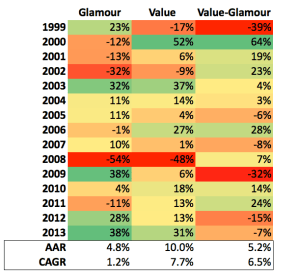
Though it started out almost 40 percent behind in 1999, value outperformed glamour over the period since 1999, beating it by 5.2 percent compound, and 6.5 percent in the average year–about the same differential for PB last week.
Market capitalization-weighted returns are useful for demonstrating that the outperformance of value over glamour is not due to the value portfolios containing smaller stocks. Unless you’re running an index (or hugging an index), they’re not really meaningful. The easiest portfolio weighting scheme is to simply equally weight each position. (If we’re prepared to put up with a little extra volatility for a little extra return, we can also Kelly weight our best ideas). Here are the equal weight return statistics for dividend yield.
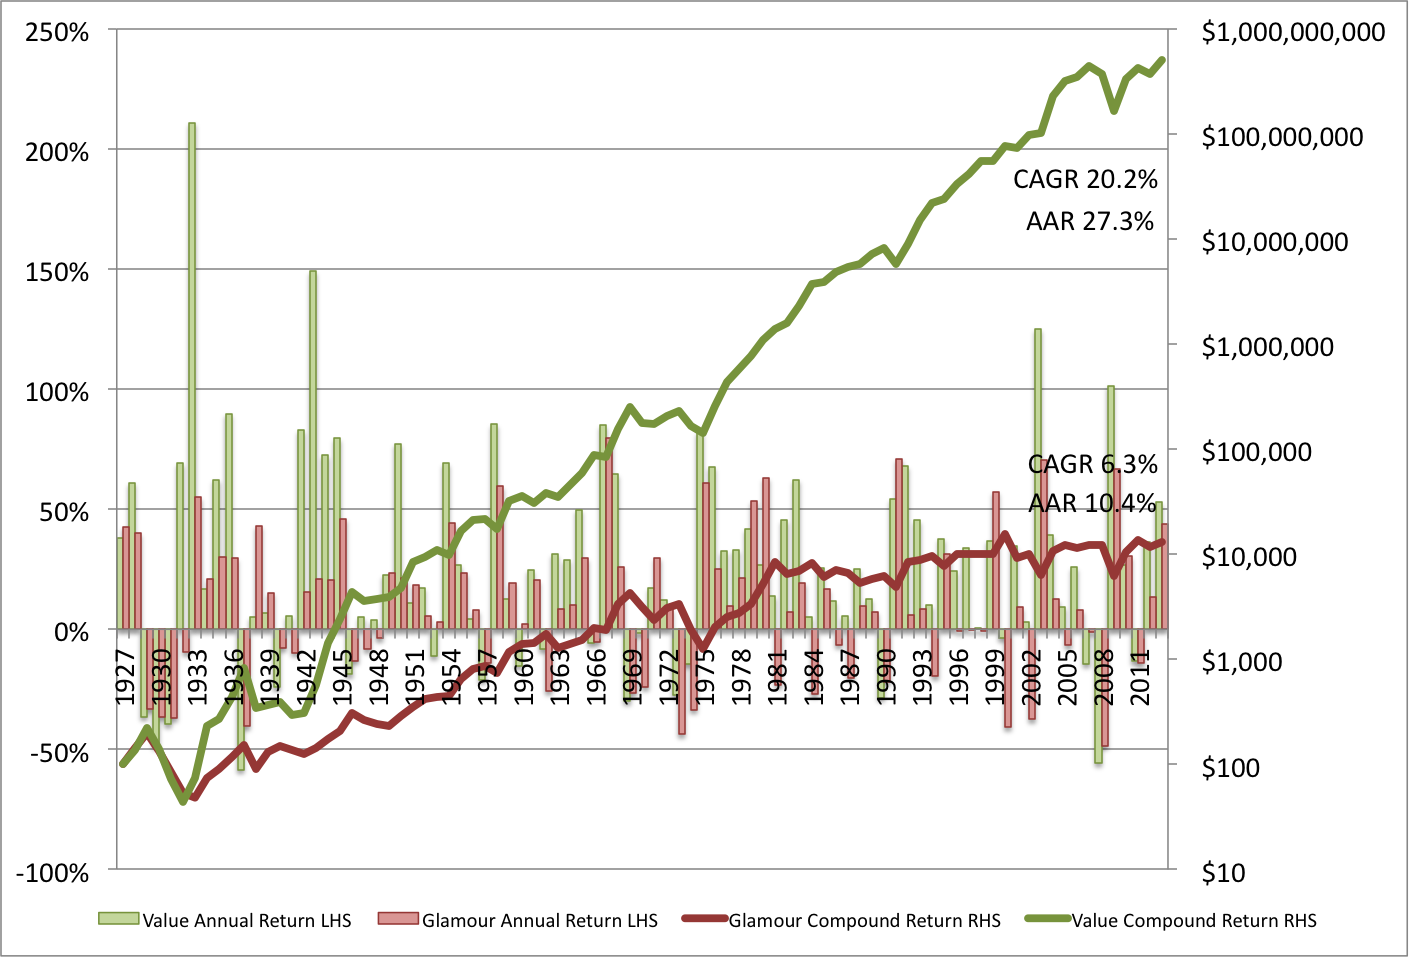
Dividend Yield Annual and Compound Returns (Portfolio Constituents Equally Weighted)

In the equal weight backtest value generated 12.7 percent compound (16.1 percent on average), beating out glamour’s 11.6 percent compound return (15.5 percent on average).
Since 1951 the equally weighted high dividend yield value decile has generated a compound annual growth rate (CAGR) of 13.5 percent and an average annual return (AAR) of 15.7 percent. Over the same period the glamour decile returned a CAGR of 12.5 percent and an AAR of 15.5 percent. These returns are still slightly lower than the returns generated by PB, PCF and PE over the same period.
Dividend Yield Value Premium (Equal Weight)
Again, the value premium was never very large for the equal weight portfolios, and has gradually diminished to 1.1 percent compound over the full period.
Decile Performance (Equal Weight)

In the equally weighted portfolios, dividend yield does an even poorer job sorting glamour and value portfolios. The dividend payers don’t even reliably outperform the non-dividend paying cohort. The No Div decile, which returned a CAGR of 13.4 percent and an AAR of 21.2 percent over the full period (and, since 1951, a CAGR of 12.4 percent and an AAR or 18.3 percent), beat out the return on the value decile.
Recent Performance (Equal Weight)
In the equal weight portfolios, value has slightly outperformed glamour since 1999, beating it by a 3.9 percent compound, and 2.8 percent in the average year.
As we’ve seen over the last few weeks, over the long run, and with some regularity, cheap stocks tend to outperform more expensive stocks. Unlike the PB, PE and PCF ratios, which are all very useful metrics for sorting cheap stocks from expensive stocks, the dividend yield is less useful. This is likely because only around 44 percent of all stocks pay dividends. The message seems to be that even expensive dividend paying stocks outperform all non-dividend payers in the market capitalization weighted portfolios, but not in the equal weighted portfolios. Dividend yield doesn’t seem to be a particularly reliable metric for sorting value and glamour.
My firm, Eyquem, offers low cost, fee-only managed accounts that implement a systematic deep value investment strategy. Please contact me by email at toby@eyquem.net or call me by telephone on (646) 535 8629 to learn more.
Click here if you’d like to read more on Quantitative Value, or connect with me on LinkedIn.