The humble price-to-earnings (PE) ratio is a remarkably well-performed fundamental ratio. While I generally favor the enterprise multiple when demonstrating the utility of focusing on intrinsic value and investing in undervalued stocks (for the reasons outlined here), I’d be very happy to run a portfolio if I was only able to use the PE ratio.
Set out below are the results of two Fama and French backtests of earnings yield (the inverse of the PE ratio) data from 1951 to 2013. As at December 2013, there were 2,406 firms in the sample. The value decile contained the 283 stocks with the highest earnings yield, and the glamour decile contained the 281 stocks with the lowest earnings yield. The average size of the glamour stocks is $4.4 billion and the value stocks $4.3 billion. (Note that the average is heavily skewed up by the biggest companies. For context, the 2,406th company has a market capitalization today of $300 million, which is much smaller than the average, but still investable for most investors). Stocks with negative earnings were excluded. Portfolios are formed on June 30 and rebalanced annually.
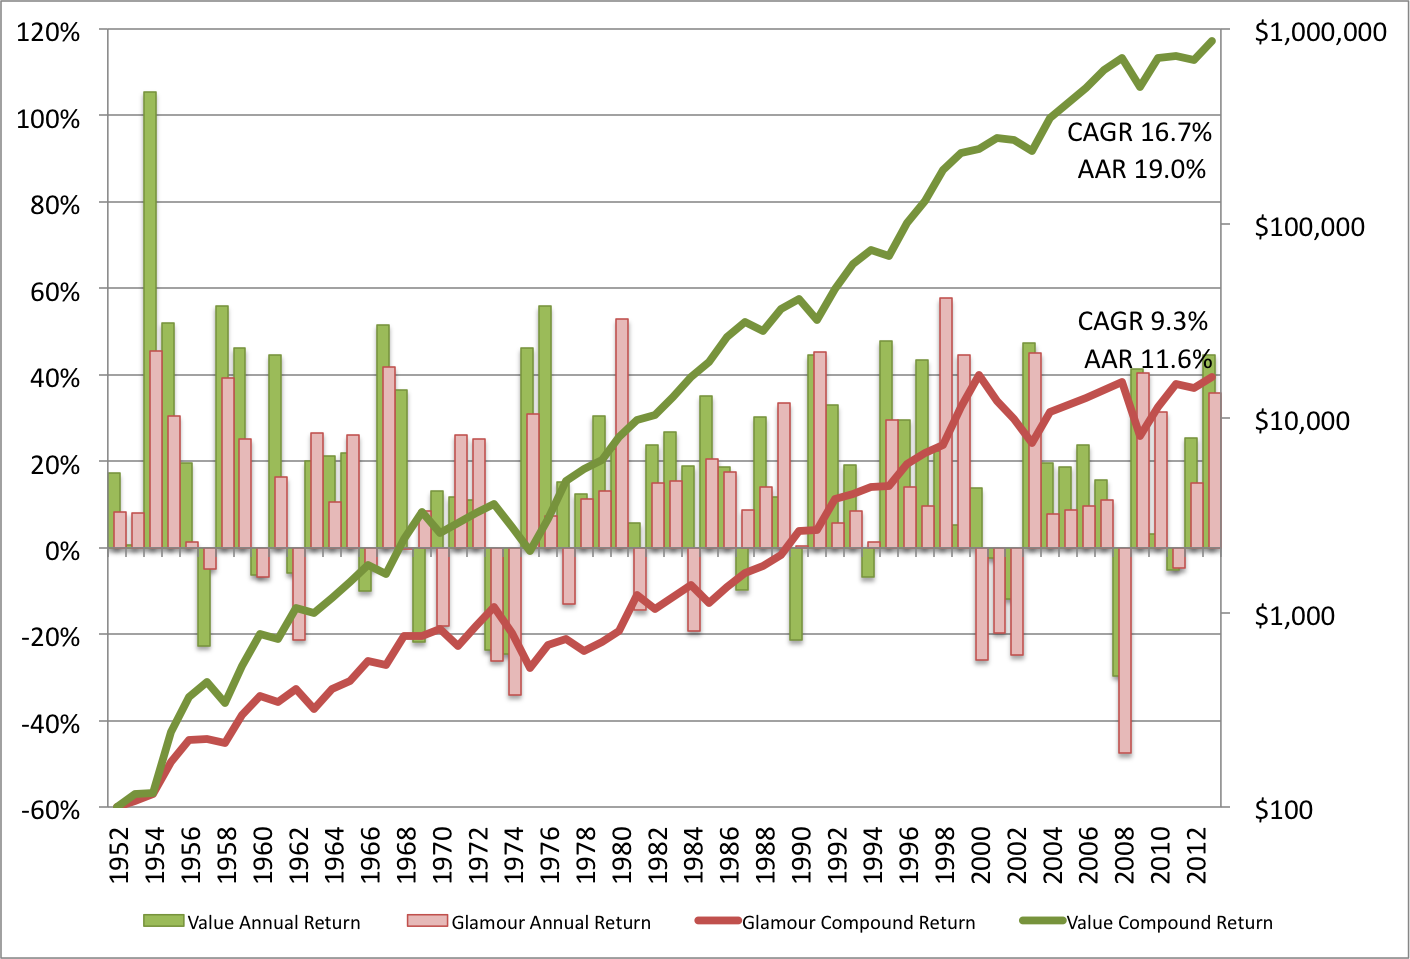
Annual and Compound Returns (Portfolio Constituents Weighted by Market Capitalization)
In this backtest, the two portfolios weighted by market capitalization, which means that bigger firms contribute more to the performance of the portfolio, and smaller firms contribute less. Here we can see that the value decile has comprehensively outperformed the glamour decile, returning 16.7 percent compound (19 percent in the average year) over the full period versus 9.3 percent for the glamour decile (11.6 percent in the average year).
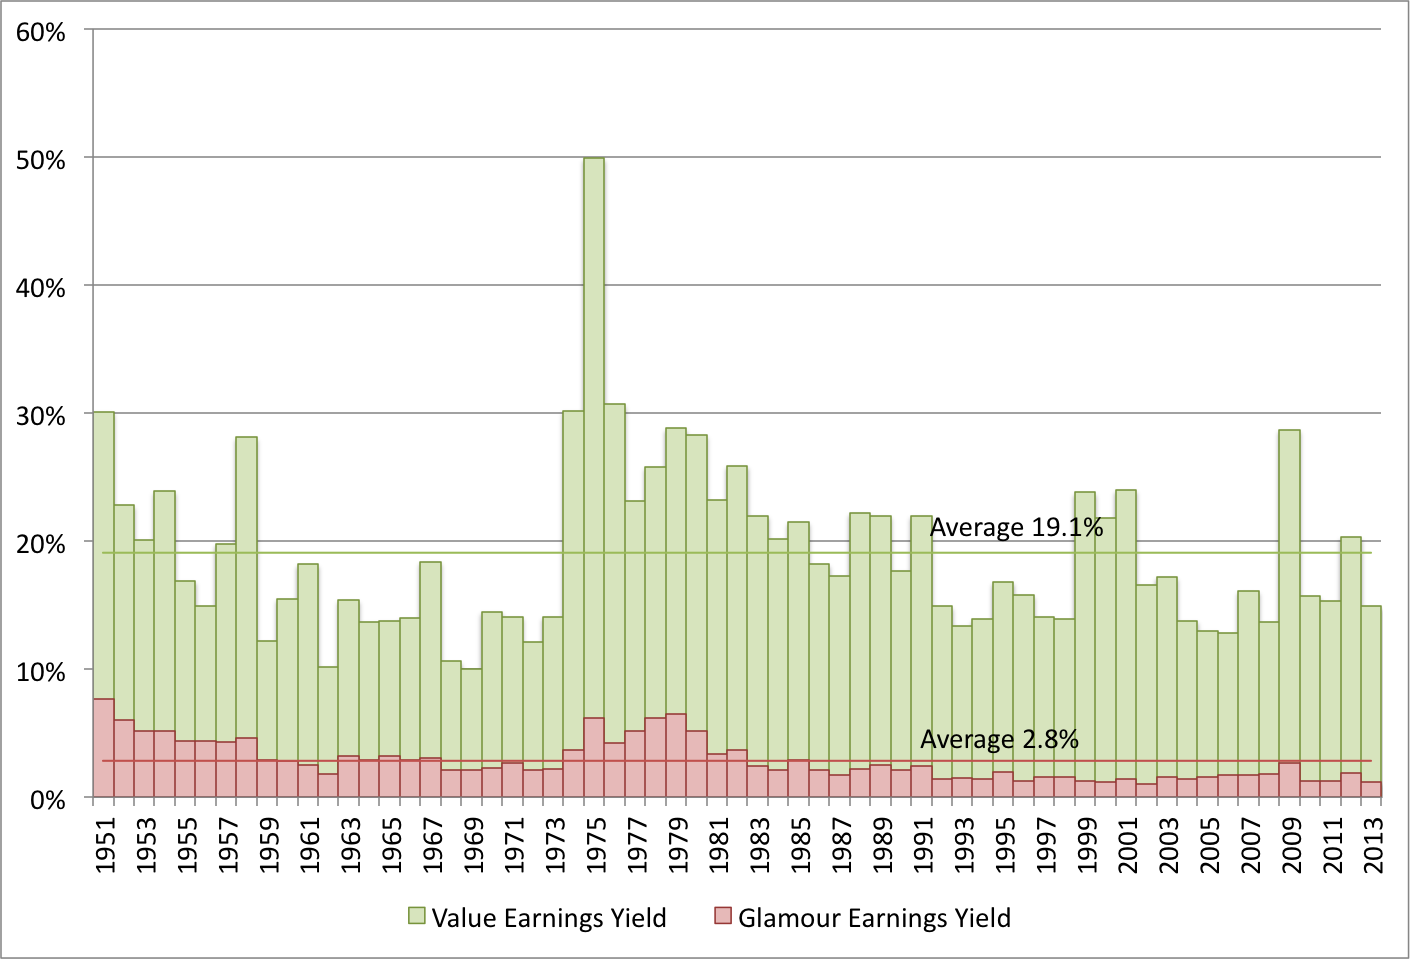
Average Earnings Yield (Market Capitalization Weight)
The reason for value’s outperformance is not very complicated. The value portfolios simply generated more earnings per dollar invested (19.1 percent versus 2.8 percent for the glamour portfolio):
Recent Performance (Market Capitalization Weight)
This is not a historical aberration. If we examine just the period since 1999, we find that, though the return is lower than the long term average, value continued to be the better bet.
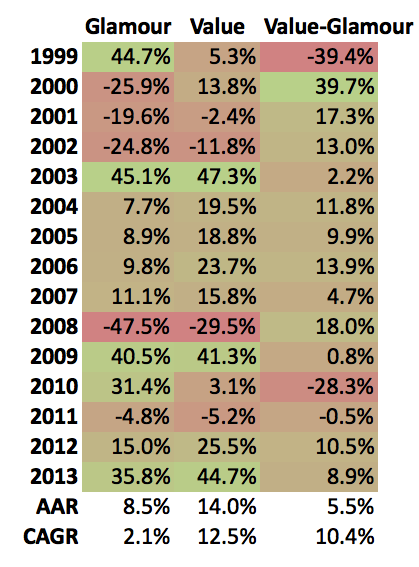
Value has massively outperformed glamour since 1999, beating it by more than 10 percent compound, and 5.5 percent in the average year. The reason for lower returns recently may be due to the ubiquity of value strategies, but more likely it’s because the market is still working off the massive overvaluation in the late 1990s Dot Com boom.
Market capitalization-weighted returns are useful for demonstrating that the outperformance of value over glamour is not a function of the value portfolios containing smaller stocks. For most investors, market capitalization-weighted returns are irrelevant because we’re not going to invest portfolio capital according to a stock’s market cap. For one thing, it’s more difficult to manage and calculate on the fly than an equal weight portfolio, and it leads to lower returns. More likely, we’re either going to equal weight the portfolio (simply equally dividing the total portfolio capital over the total number of positions, say 10 to 30 stocks) or Kelly weight our best ideas. The equal weight returns are therefore more useful for most investors. For equal weight portfolios, the smallest stock is the most important one because the smallest stock constrains the portfolio capital, setting the maximum capital that can be invested in every other stock in the portfolio. (Recall that the smallest company in the sample has a market capitalization today of $300 million, which is investable for most investors.)
Annual and Compound Returns (Portfolio Constituents Equally Weighted)
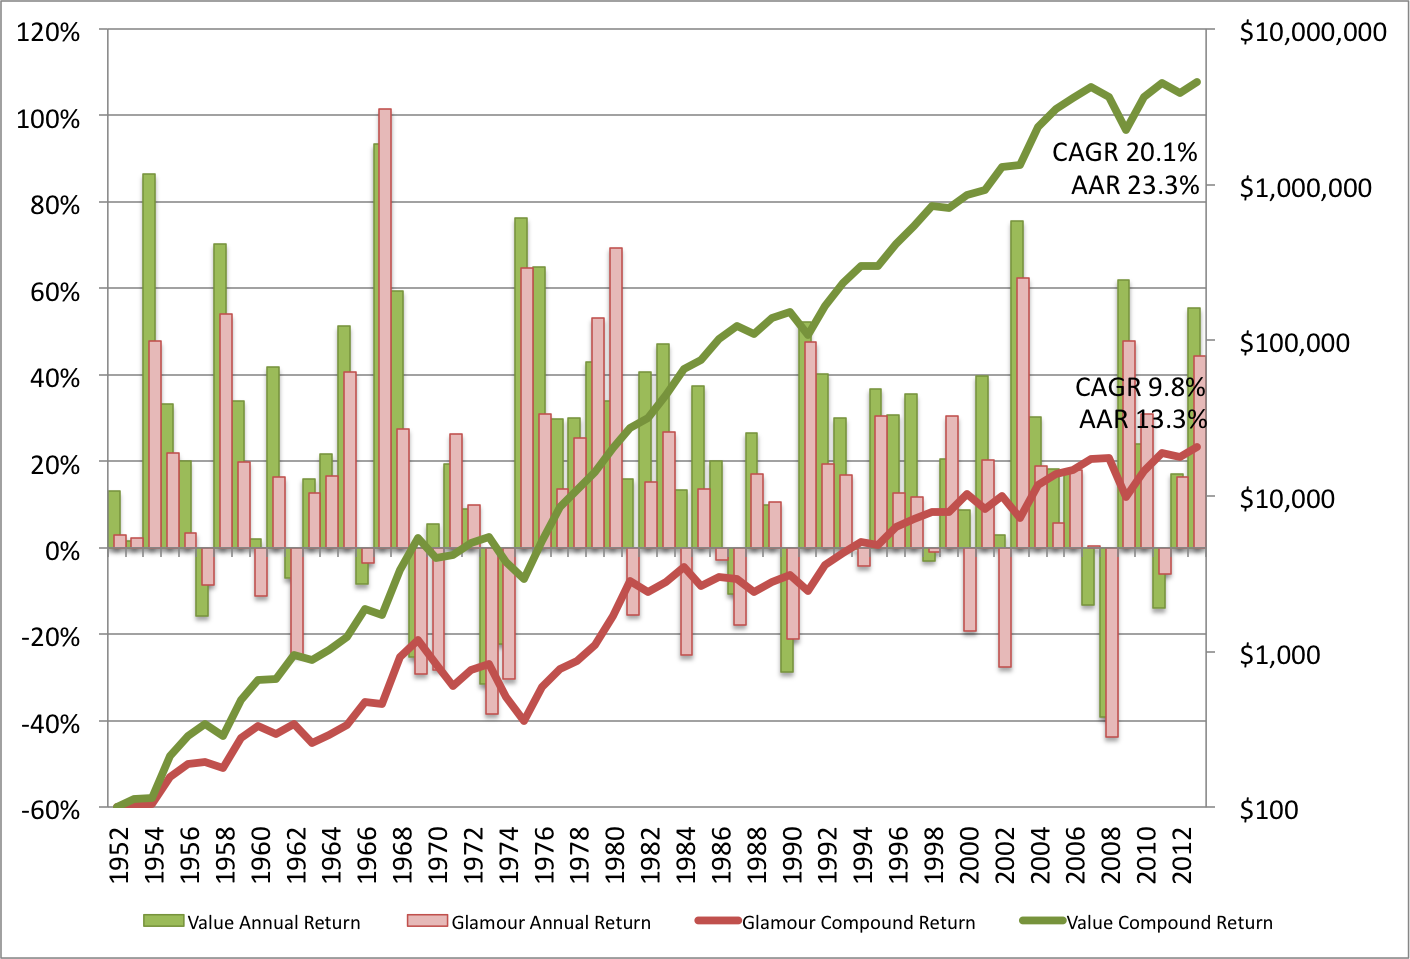
In the equal weight backtest value generated 20.1 percent compound (23.3 percent on average), beating out glamour’s 9.8 percent compound return (13.3 percent on average).
Average Earnings Yield (Equal Weight)
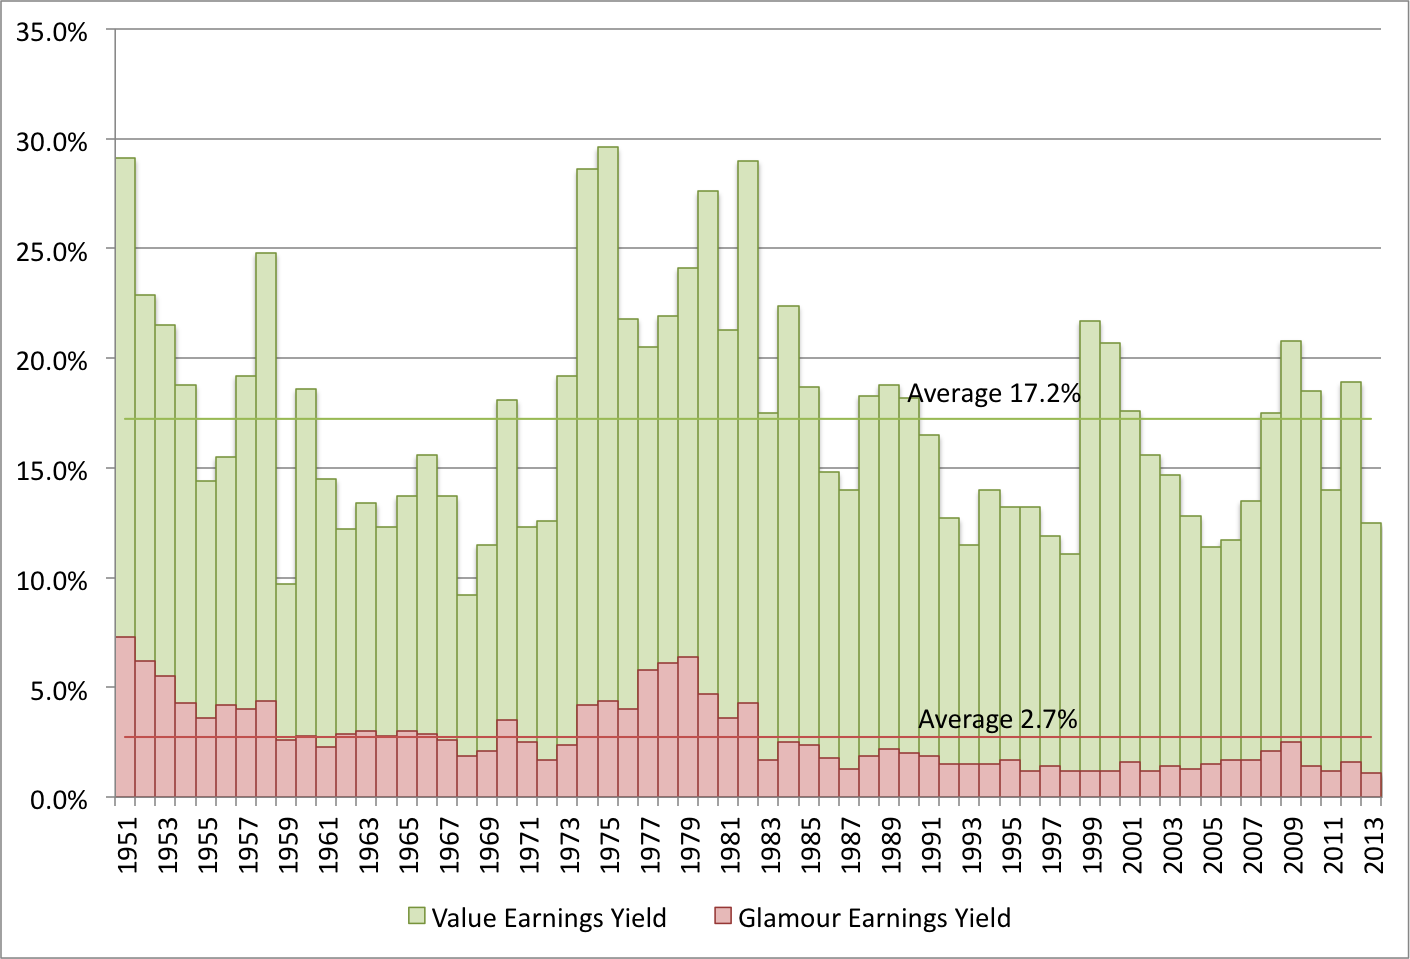
Again, the value portfolios simply out-earned the glamour portfolios, generating 17.2 percent on average versus 2.7 percent in the glamour portfolios. It’s interesting to note that the average earnings yield for the equally weighed value portfolio is slightly lower than the average earnings yield for the market capitalization-weighted portfolios, which indicates that, over the full period, bigger stocks tended to be a cheaper method for buying earnings than smaller stocks. That won’t always be the case, but it’s interesting nonetheless.
Recent Performance (Equal Weight)
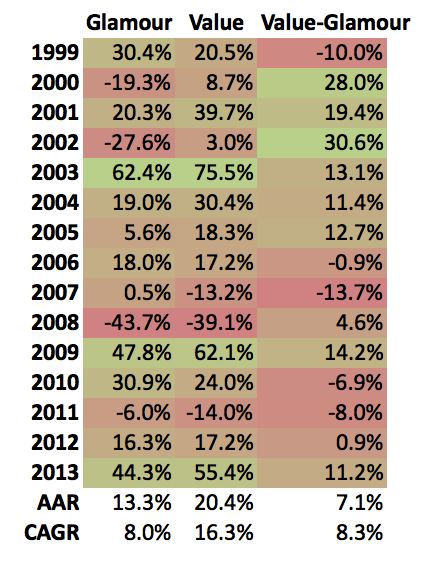
In the equal weight portfolios, value also outperformed glamour since 1999, beating it by 8.3 percent compound, and 7.1 percent in the average year.
Over the long run, cheap stocks tend to outperform more expensive stocks, and the PE ratio is useful metric for sorting cheap stocks from expensive stocks.
My firm, Eyquem, has just started offering low cost, fee-only managed accounts that implement a systematic deep value investment strategy. Please contact me by email at toby@eyquem.net or call me by telephone on (646) 535 8629 to learn more.
Click here if you’d like to read more on Quantitative Value, or connect with me on LinkedIn.


[…] Carlisle har skrivit om det på Greenbackd och visat att man kan få en riktigt bra avkastning för det, om man helt enkelt investerade i […]
LikeLike
[…] Value also outperforms the market. Whether we examine the simple fundamental metrics like the price-to-earnings (PE) ratio, the price-to-book value (PB) ratio, and the price-to-cashflow (PCF) ratio, […]
LikeLike
[…] simple fundamental metrics the subject of backtests on this site over the last four weeks: the price-to-earnings (PE) ratio, the price-to-book value (PB) ratio, the price-to-cashflow (PCF) ratio, and the dividend […]
LikeLike
[…] Price-to-Book Value Ratio or Book Equity-to-Market Equity Multiple (Backtests 1926 to 2013), Investing Using the Price-to-Earnings Ratio and Earnings Yield (Backtests 1951 to 2013) and Investing Using Price-to-Cashflow Ratio and Cashflow Yield (Backtests 1951 to 2013)). The […]
LikeLike
[…] than the returns found for the price-to-earnings and cashflow ratios over the last few weeks (see Investing Using the Price-to-Earnings Ratio and Earnings Yield (Backtests 1951 to 2013) and Investing Using Price-to-Cashflow Ratio and Cashflow Yield (Backtests 1951 to 2013)). The […]
LikeLike
[…] These returns are practically identical to the returns found for the price-to-earnings ratio in last week’s post (Investing Using the Price-to-Earnings Ratio and Earnings Yield (Backtests 1951 to 2013)). […]
LikeLike
[…] More evidence that cheap stocks, based on earnings, outperform. (Greenbackd) […]
LikeLike
Yeah, Cheap stocks do great as a group. If I were to use the PE ratio to put together a portfolio, though, I’d want to do some digging and refine the list to screen out one time earnings windfalls, highly volatile earnings, etc, to get to normalized earnings. I best that some out outperforming the list, while others are lagging, and it’s my guess that the stocks that lag are the ones that would be screened out.
LikeLike
now if you could just provide stock names that are in the value category (now) :-)
LikeLike
[…] More evidence that cheap stocks, based on earnings, outperform. (Greenbackd) […]
LikeLike
Have you ever seen a paper where they have shown what PE ratios you were actually paying? All the ones I’ve seen have sorted by decile or quintile but didn’t show what PE ratio you were actually paying. It’d be interesting to see how the returns varied.
Also, have you ever seen a backtest of Graham’s defensive investor criteria? I’d be interested to see that. Thanks
LikeLike
I have the PE ratio data. I’ll put it into a future post.
I haven’t seen a backtest of Graham’s defensive investor criteria. I’d also be interested to see that.
LikeLike
Awesome, I was about to ask a similar thing in reply to Marc’s post below.
I’ve seen lots on the blogs lately about the CAPE and similar, and future returns *of the market*.
But I’d like to know what the returns are to the value decile, not the market.
And; matt jones’ suggestion is an even better way to do it (as we’re testing the humble, well known, single-year PE)….what was the average / median PE of the value decile and the following 1 year return?
LikeLike
I read a recent test (only covering just over a decade though) that was very close to the defensive rules (allowing for leniency re: dividends mainly, understandably) that showed results around 15% (compound) – well outperforming the S&P500 – assuming the backtest was reliable etc.
LikeLike
Tobias, I am more concerned about where we are, rather than how we get there. The Avg. Earnings Yield charts seem to indicate all valuations are approaching high points. Thanks
LikeLike
Yes. Note that the single-year PE measures aren’t particularly predictive of returns. The long-term and cyclically adjusted measures, which are more predictive, but over a longer period, put the market in rare air.
LikeLike
[…] ….. […]
LikeLike
These are my favourite type of posts…and I especially appreciate the way you took pains to explain terms that would be familiar to some, and explain exactly what you were doing (e.g. excluding negative earnings)…so often good academic research is hard for the lay (but keen) solo / retail investor to decipher exactly what is going on.
One thing I like (love!) about the confirmation of the value strategy via the PE ratio is that it is such a *known* strategy and for such a long time. Someone could have bought a David Dreman book in the 90’s, implemented it, and produced the results you provided above.
Another thing I note as I put my pessimistic hat on for a moment to look for the worst case…
Someone who picked a terrible time to start this strategy (June 30, 2006) and lost half their capital over the next two years…BUT STUCK WITH IT (knowing that others have had big drawdowns and stuck with it)…..only 2 years later they were just over breakeven. To test their stick-ability, they then had another loss that saw their capital down around 10% followed by another year that took them to above breakeven (only 7% made over the 6 year period; and that’s 7% on capital, not per annum). Sticking with it for another (bonza) year now sees them at mid-2013 with a 7.5% compounded return, not bad over the past 7 years.
But it took 7 years of sticking with it to get it!
That’s why I’m convinced (at least for all practical reasons) that value will continue to “work” – it’s simply not the case that everyone (individual or institutional for other reasons) could stick with this.
BTW, was this data including or excluding dividends? If excluding dividends, then this 7.5% annual return doubled the S&P 500 return over the same period. (If your results included dividends, this is not correct so please ignore).
One more “BTW”….
I know that the P/B (B/M) is not loved anymore by anyone, and when looked at for statistical significance on large caps in the academic papers, the effect is not there etc etc.
But in practical terms (as you have done here with the P/E)….does it still work? (i.e. investable universe for average investor, annual re-balancing, equal weighting)…do you know?
LikeLike
Thanks, Steve. These results did include dividends. I have a few more backtests coming up over the next few weeks, including a look at PB. The PB data goes back to 1926, so you’ll see the fireworks at the end of the 20s. It seems to have continued to work.
LikeLike
Hi Tobias,
Thanks for the backtest results. May I know if you’re using survivorship-bias-free data?
Ernie
LikeLike
You may. I am :)
LikeLike
i am also a deep value investor and focus on low valuations. my experiences tell me that it is a successful strategy in the long term.
LikeLike