Many value investors regard the period since the beginning of 2008 as a difficult one for value strategies. After the bonanza for value in the early 2000s, when a number of value guys made their name, the going has been much tougher in the latter part of the 2000s, and early 2010s. One theory for the lower performance of value–the one to which I subscribe–is that value stocks were much cheaper in the early 2000s than they have been since because the dot com boom was mostly restricted to big, “new economy” stocks. Smaller “old economy” stocks were neglected, and unusually good value. (For more on this, see for example, this post: Implications of All-Time-High Median Valuations).
Another theory is that value strategies are now so well known and easy to implement that undervalued stocks are completely picked over, and the only cheap stocks left are value traps. Call this the “Magic Formula” effect, named for Joel Greenblatt’s cheap but good strategy discussed in his Little Book That Beats The Market, which was published in 2006. The argument goes something like, “The Little Book and the free website have made it so easy to find good, cheap stocks that there’s nothing left.” (I have a few thoughts on how to beat The Little Book That Beats The Market).
To see how tough it has been for value investors, and the impact of the Magic Formula effect, I backtested the performance of four indexes against the value decile of each (measured by the enterprise multiple or EBITDA / enterprise value —overview of the research on the enterprise multiple here). The universes I tested were the S&P 500, the Russell 1000, the Russell 3000 and the Russell 2000. As always, I lagged the fundamental data by 6 months (so portfolios formed 1/1 in year t use data from 6/30 in year t-1). All portfolios are equally weighted (for example, the 300 stocks in the Russell 3000 value decile hold 0.333 percent of the theoretical portfolio capital at inception and the ~3,000 stocks in the Russell 3000 portfolio hold 0.0333 percent of portfolio capital at inception). In the chart below, the value deciles are a hue of green, and the indexes are all reds.

EBITDA/EV Value Deciles versus Indexes (2008 to Present)
The chart shows that all the value deciles have comprehensively outperformed each of the indexes over the full period since 2008. It’s not even close. And a great deal of the outperformance seems to be recent. Here are the statistics for each index and the corresponding value decile.
S&P 500
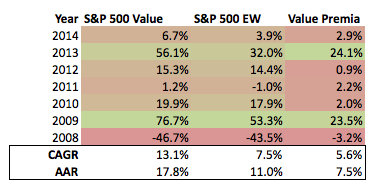
The S&P 500 is the largest, most liquid index, containing the largest ~500 stocks in the market. The smallest company has a market capitalization greater than $3 billion. It is heavily picked over. If ever there was an index that should suffer from the Magic Formula effect, this is it. Here we find that the value decile generate 17.8 percent per year compound, outperforming the index by 5.6 percent per year compound over the full period (and by 7.5 percent on average). $100,000 invested in the value decile in 2008 is worth $219,610 today, versus $158,440 for the S&P 500. The value decile also beat the S&P 500 in 6 out of 7 years, slightly underperforming in 2008. Value still works in S&P 500.
Russell 1000

The Russell 1000 contains the largest 1000 stocks in the market. The value decile returned 19.8 percent compound over the full period, beating its corresponding index by 7.0 percent per year compound (and by 10.7 percent on average). $100,000 invested in the value decile in 2008 is worth $227,280 today, versus $151,920 for the Russell 1000. Though the value decile outperformed by a wide margin over the full period, the value decile only beat the Russell 1000 in 4 out of 7 years. When it did outperform, however, it did so by a lot: 60.2 percent in 2009 and almost 20 percent in 2013.
Russell 3000
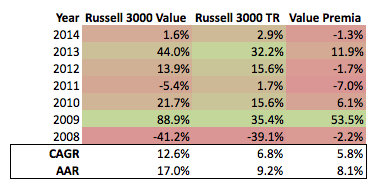
The value decile of the Russell 3000–the largest 3000 stocks in the market, and the broadest investable universe–returned 17 percent compound over the full period, beating out its index by 5.8 percent per year compound (and by 8.1 percent in the average year). $100,000 invested in the value decile in 2008 is worth $213,190 today, versus $152,540 for the Russell 3000. Here we find something interesting. Though the value decile outperformed over the full period, it only outperformed the market in 3 out of 7 years, which means that the value decile underperformed the Russell 3000 more than half the time. Perhaps this is the Magic Formula effect in action. Still, you were better off in the value decile by a wide margin over the full period. (Even if you started in 2010, and missed the big year of outperformance in 2009, you were still ahead of the Russell 3000 by 16.2 percent compound versus 14.9 percent for the index to today.)
Russell 2000
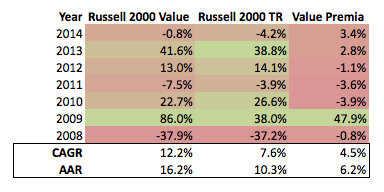 The Russell 2000 is the smallest 2000 stocks in the Russell 3000 (the same universe as the Russell 3000 excluding the largest 1000 stocks). The value decile generated 16.2 percent compound over the full period, beating the Russell 2000 by 4.5 percent per year (or 6.2 percent in the average year). $100,000 invested in the value decile in 2008 is worth $207,930 today, versus $159,990 for the Russell 2000. Again, though the value decile outperformed by a wide margin over the full period, it only beat the Russell 2000 index in 3 out of 7 years, less than half the time.
Value investors are right. The period since 2008 has been more difficult for value strategies than it was in the early 2000s. But simple value strategies have still outperformed over the full period, and by a wide margin. This is despite the fact that, in many instances, the value decile often underperforms the market, and in some cases, more than half the time. If that’s the impact of the Magic Formula effect, I’ll take it.
My firm, Eyquem, has begun offering low cost, fee-only managed accounts that implement a deep value investment strategy. Please contact me by email at toby@eyquem.net or by telephone on (646) 535 8629 to learn more.
Click here if you’d like to read more on Quantitative Value, or connect with me on LinkedIn.


I tried using one of the screeners out there to generate a MF portfolio, but then realised that the stocks my screener recommends is TOTALLY different from Greenblatt’s screener. Maybe that’s the reason why most research finds a lower return than what he says in the book?
LikeLike
Toby,
Why did you not combine price to book with the price to earnings ratio? After all you wrote an article on doing this in 2010: How P/E juices P/B returns: https://greenbackd.com/2010/03/01/how-pe-juices-pb-returns/ . The results reported at that time were quite spectacular.
Any advice on how to winnow the 283 stocks to about 15 based on easily available metrics? Novy Marx’s Gross profits to assets are not accessible on google, finviz etc.
LikeLike
I wanted to show how the simple TTM PE ratio had performed. We wrote a book on winnowing the cheap stocks down into an investable portfolio called Quantitative Value.
LikeLike
Hi Toby,
I am a big fan of your book, Quantitative Value, and have already placed a pre-order for your next book on Amazon to be published later this year.
Unfortunately many of the strategies are not easily applicable in the real world using free screeners e.g. google and finviz. Also, my edge as a small player is to invest in nano/microcaps and that is not addressed in your book or on Turnkey Analyst.
It would be truly helpful to the audience at your blog if you described simple winnowing tactics that are implementable via free scanners. I think finviz is the best in that regard.
Your article on combining PE and PB showed amazing results and it would be of immence help to us all if you discussed it again.
Thanks for all that you do for the little investors Toby.
Kind regards.
Al
Al Agedo
Sent: Tuesday, May 27, 2014 at 12:22 PM
LikeLike
Thanks Al. I’ve addressed it in bits and pieces on the ~700 or so posts on the blog but I’ve never combined the best into one document. I think that’s a good idea. I’ll put it together and get it out over the next few months.
LikeLike
Thanks so much Toby. Would you be able to create an article around selecting 15 stocks using the Finviz screener which is by far the best free screener avaiable to average Joe: http://finviz.com/screener.ashx?v=111&ft=4
It has micro/nano caps, PE, PB, PS, 6/12 months performance etc. (though not EBIT or EBITDA/EV nor Gross profit/assets).
In future articles please do mention the combination of PE and PB as you had discussed in 2010. Also, I wonder why you have not mentioned 6 month momentum since that seems to have a wonderful synergism with value.
Thanks again Toby for everything.
Regards.
Al Agedo
Sent: Tuesday, May 27, 2014 at 1:07 PM
LikeLike
[…] Value Versus The Market Since: The Magic Formula Effect Theory is that value strategies are now so well known and easy to implement that undervalued stocks are completely picked over, and the only cheap stocks left are value traps. Call this the “Magic Formula” effect, named for Joel Greenblatt’s cheap but good strategy discussed in his Little Book That Beats The Market https://greenbackd.com/2014/05/19/value-versus-the-market-since-2008-spy-iwv-iwm-iwb-the-magic-formul… […]
LikeLike
Value stocks beat Buffett over the last 15 years
http://www.marketwatch.com/story/beat-warren-buffett-at-his-own-game-2014-05-14?pagenumber=2
LikeLike
[…] Mattered Most (The Atlantic) • Value Versus The Market Since 2008: The Magic Formula Effect (Greenbackd) • WTF?! Fox Gives Show To SEC-Fined Analyst Who Was Paid To Push Now Worthless Stocks (Media […]
LikeLike
[…] Why value managers have had a tough time outperforming their benchmarks. (Greenbackd) […]
LikeLike
[…] …………. […]
LikeLike
Unfortunately, I wasn’t using value in the early 2000s but I’m sure the returns were juicy.
If you look at the returns in your charts, a lot out the excess performance comes from only a few years. If investors missed those returns, or weren’t fully invested during those periods, then their results would be a lot lower. Because of that, my basic strategy is to invest in as many high quality situations as I can with the goal of being fully invested when enough opportunities are there and maintain my selection standards but try to buy into as many high quality situations as possible during red hot markets. That should still leave a chunk of my portfolio in cash during frothy markets which can buffer a market drop.
Also, picking the best cheap stocks strategy helps enormously.
http://www.netnethunter.com/buy-cheap-stocks/
Evan
LikeLike