I’ve posted here regularly about the implications of mean reversion in elevated profit margins (see, for example, The Temptation To Abandon Proven Models In Speculative and Fearful Markets: Why This Time Isn’t Different, What Record Corporate Profit Margins Imply For Future Profitability and The Stock Market, Warren Buffett, Jeremy Grantham, and John Hussman on Profit, GDP and Competition). Those posts sparked some intense debate in the comments and offline about the increasing influence of foreign profits on corporate profit margins, and how this change may have permanently shifted up the mean for corporate profits as a proportion of GDP. The impact of such a structural change in the mean is twofold: First, it implies that the current cyclical extreme in the level of corporate profits as a proportion of GDP is less extreme than it appears on its face; and, second, that the ratio of corporate profits-to-GDP is less predictive as an indicator than it has been historically.
This is the chart, and the following comment, that sparked the debate:
Source: Hussman Weekly Comment “Taking Distortion at Face Value,” (April 8, 2013)
Hussman commented in relation to the chart (in Two Myths and a Legend, March 11, 2013):
In general, elevated profit margins are associated with weak profit growth over the following 4-year period. The historical norm for corporate profits is about 6% of GDP. The present level is about 70% above that, and can be expected to be followed by a contraction in corporate profits over the coming 4-year period, at a roughly 12% annual rate. This will be a surprise. It should not be a surprise.
Raj Yerasi, a money manager based in New York, has taken on the unenviable task in the following guest post of arguing the case that the increasing influence of foreign earnings on corporate profit margins means that the ratio in the chart overstates future mean reversion in earnings:
Profiting From Profits
Today more than ever the question of whether the stock market is overvalued or reasonably valued depends on whether corporate profit margins are abnormally elevated or sustainable. Some astute investors (such as Hussman and GMO) have argued in essence that the combination of record government deficit spending and unemployment levels has propped up corporate revenues while lowering labor costs, thereby boosting corporate profit margins by as much as 70 percent above historical averages. They contend that the withdrawal of fiscal stimulus as well as competitive dynamics will sooner or later cause profit margins to revert to the mean, unmasking substantial equity overvaluation.
This analysis purports to show that profits are indeed elevated above historical levels, but not nearly as much as some investors think, due to issues in the BEA’s NIPA data series they are using. Furthermore, the impact of any mean reversion in profit margins on overall equity market profits may be lower than people think.
To understand this, it is important to note that current analyses do not directly measure profit margins per se (meaning, profits divided by revenues). Rather, they measure corporate profits as a percentage of GDP, which captures not total revenues but the total value addition of corporations (along with other components). While there are multiple potential data issues in comparing profits to GDP, it nonetheless stands to reason that profits as a percentage of GDP should generally correlate with profit margins.
However, one big source of error is that the most widely known NIPA corporate profits data series, which the analyses referenced above appear to be using, represents profits generated by corporations that are considered US residents. As such, this data series includes profits generated by US companies’ international operations (e.g. Coca-Cola India, Coca-Cola China) and excludes profits generated by foreign companies’ US operations (e.g. Toyota USA). GDP, meanwhile, captures all economic activity within US borders, whether undertaken by US companies or foreign companies, and it excludes any economic activity abroad. It should be clear that one cannot compare these two metrics, since the corporate profits data series introduces profits generated by other economies and excludes profits generated by the US economy.
Since we are interested in how profit levels have changed over time, this mismatch might not matter, except that US companies’ profits from abroad have grown tremendously over the last 10 years, much more so than foreign companies’ profits from US operations:
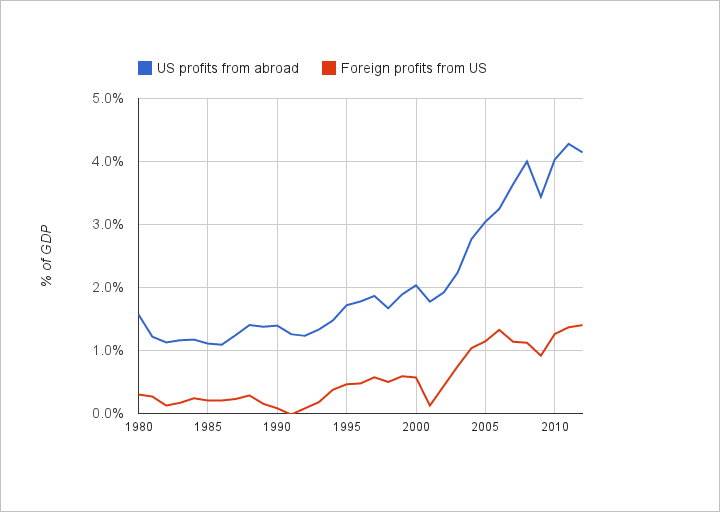
This skews the calculated profits level upwards and by an increasing amount over time, making profit levels today look exceedingly elevated.
To do the analysis correctly, we need to use data that are more apples-to-apples. Fortunately, the NIPAs do include a data series of corporate profits that simultaneously excludes US companies’ profits from abroad and includes foreign companies´ profits from US operations, called “domestic industries” profits. Comparing these profits to GDP, profit levels still appear elevated but now not as much as when using the prior “national” profits data series:
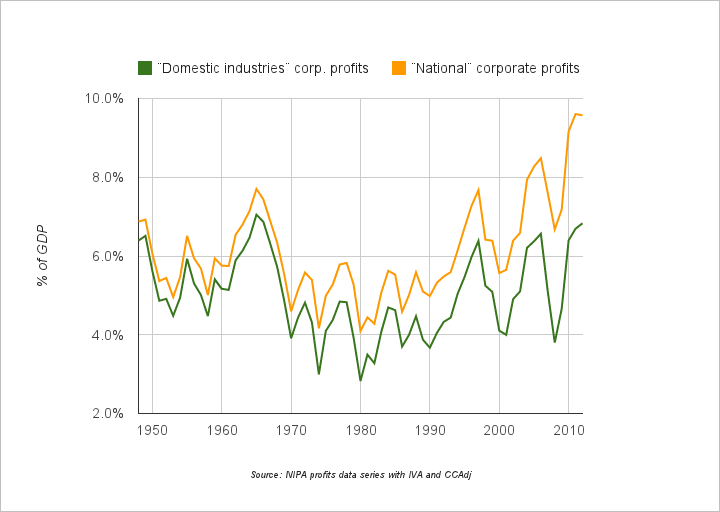
Profits now appear to be at levels matching previous highs rather than at levels far exceeding previous highs. Comparing these levels to the average level since 1948, current profit levels are 40 percent above the average, with this average including an extended contractionary period in the 70s and 80s.
It is worth noting that these percentages match very closely with those cited by Warren Buffett in his 1999 article “Mr. Buffett On The Stock Market“. If we use the 4.0 percent to 6.5 percent range that Mr. Buffett observed as a “normalcy” band, then profit levels today are about 30 percent above the midpoint of that band. That is high, no doubt, but not as terrifying as 70 percent above the average.
It is also worth noting that effective corporate tax rates are lower today than in the past. Per the NIPA data, tax rates have decreased from about 45 percent in the 80s to 40 percent in the 90s to 30 percent in recent years. Using pre-tax “domestic industries” profits as a percentage of GDP, profit levels today may be closer to 20 percent elevated relative to historical norms. One may wish to focus solely on after-tax profit levels, since in theory companies target minimum after-tax returns on capital, but on the other hand, a consumer deciding whether it’s worth paying a premium for a company’s product or service may not be affected by that company’s tax burden. The right approach could be somewhere in between.
So what are the implications of all this? The actual extent and pace of mean reversion in profit margins will depend on other factors besides fiscal consolidation and unemployment: trade deficits, credit creation, tax policy, antitrust enforcement, etc. Setting all that aside, if we assume that profit margins of domestic businesses are, say, 30 percent higher than where they should be and will be, then we also need to figure out what percentage of equity market index earnings come from domestic operations. If we assume that, say, 1/3 of index earnings are from international operations that will not be affected by mean reversion in US profits, then the total drop in index earnings might only be 15 percent (since mean reversion from a 30 percent higher level implies a 23 percent drop, but only on 2/3 of earnings).
This is not to say, of course, that the consequences of mean reversion would be evenly distributed by sector. Perhaps investors are better off taking into account mean reversion on a sector by sector basis, given that we do not seem to be looking at a scenario of plummeting earnings that will sink all boats.
Special thanks to Andrew Hodge of BEA for clarifying certain NIPA data. Any remaining misunderstandings are the author´s responsibility.
—
Many thanks to Raj for a well-written argument.
Hussman anticipated Raj’s argument earlier. See The Temptation To Abandon Proven Models In Speculative and Fearful Markets: Why This Time Isn’t Different for Hussman’s rejoinder.
Order Quantitative Value from Wiley Finance, Amazon, or Barnes and Noble.
Click here if you’d like to read more on Quantitative Value, or connect with me on LinkedIn.


Thanks, Keith. Glad you liked the article.
Hi Jeff, I wasn’t able to reply sooner as I was traveling abroad without internet access last week. But here are my thoughts re: the points you’ve made:
(1) While the right analogue to “national” corporate profits may be GNP, it’s not enough for the data to be apples to apples; the data also have to be relevant. I think GDP is more relevant than GNP to the debate at hand because we are trying to understand the effects of macro variables (gov’t deficit spending, credit creation, trade deficits, etc.) on profit margins in the US economy. Using GNP introduces the question of profit margins in foreign economies and whether those might be elevated or depressed based on those economies’ macro factors. Plus it excludes some portion of the US economy. So I believe the best approach is to use GDP and then use a more apples-to-apples data series for corporate profits, which is “domestic industries” corporate profits.
I say “more” apples-to-apples because comparing corporate profits to GDP is not perfect and presents other potential data issues (as I alluded to in my article). For example, corporations are not the only source of production in GDP; the NIPAs separately account for non-corporate businesses like sole proprietorships, partnerships, and government enterprises. In addition, there are non-business sources of production, such as nonprofits, households, and government. The percentages contributed by each of these sources of production change over time, causing further potential “tracking error” when looking at corporate profits as a percentage of GDP over long periods of time.
For example, per the NIPAs, corporations’ share of total business income has increased from 63% in 1948 to 75% in 2011, with non-corporate businesses losing share. This by itself would cause corporate profits to look artificially elevated in recent years when looking at profits as a percentage of GDP, except that total business income as a share of national income has declined from 87% to 75% over that same time period, with the non-business entities (nonprofits, households, and government) gaining share. Net net, corporations’ share of national income ended up being fairly flat over that time period, which is why I did not highlight this in my article. Still, this is really by happenstance and it’s quite possible there could be more serious tracking error in decades prior to 1948.
Coming back to GNP, since even “national” corporate profits are not completely apples-to-apples (the issues mentioned above still apply), I wonder if using these data might actually skew the profit levels upwards since they would capture corporate activity abroad but very little non-corporate activity. But I haven’t investigated this, as I think GDP is simply a better metric to use.
Apologies if my digression is more detail than anyone wants.
(2) I don’t understand what you mean. I haven’t stated anywhere that “national” corporate profits minus “domestic industries” corporate profits equals foreign profits. In fact, I’ve stated something different.
(3) Again, we are trying to understand the effects of macro variables on profit margins in the US economy. That is step 1. Then we take step 2, which is applying this and other factors to the stock market. Put another way, it doesn’t matter to me if I’m including profits that affect a company on the LSE, so long as those profits are generated in the US and are thereby influenced by the US macro variables mentioned before.
(4) I was laying out some numbers to give readers a sense of the possible impact of any mean reversion. You can take whatever approach you like. I would just point out that 4.0-6.5% is a pretty big range, and being at 4.0% or 6.5% still leaves one susceptible to mean reversion.
(5) The point about lower interest rates improving profit margins is an interesting one. To the extent that pre-tax profits matter vs. after-tax profits (per my discussion of lower tax rates in the article), then lower interest rates could indeed account for higher after-tax profit margins. I have not gone into this in my article because (a) this data is not available in the NIPAs, and (b) my rough sense (having looked at the S&P 500 as a proxy) is that it’s not having nearly as big an impact as the lower tax rates.
Really rough numbers (my info may be out of date), I believe debt is around 27% of assets of the S&P 500 (excluding financials). However, although low interest rates on debt should help profits, low interest rates on cash would hurt profits. So we shouldn’t look only at debt–we should look at net debt. I believe cash and cash equivalents are about 11% of assets, which implies that net debt is about 16% of assets.
I believe ROA is around 6-7% of assets of the S&P 500 (excluding financials). On a pre-tax basis, let’s call it 10%. From this, we can get a sense of the impact of a drop in interest rates (although the effects may take time to manifest since some of the debt and/or cash may have longer term maturities). A 200 basis point drop in interest rates, on 16% net debt to assets, should increase pre-tax profit to assets by 0.32%. On 10% pre-tax profit to assets, that’s about a 3% increase in profits (pre-tax and after-tax). Meanwhile, tax rates dropping from 40% to 30% would increase after-tax profits by about 17%. The actual interest rate drop depends on the mix of short, medium, and long term interest rates, but even if you think the average interest rate dropped 4%, that’s still just about a third the impact of lower tax rates.
I didn’t do a lot of work on this, so it’s possible my rough analysis above is incorrect (please correct me if so). It’s also possible that net debt balances have changed over time and that could have an impact on profit margins, as well. But, again, my sense is that interest rates are having a more minor impact here.
Re: profit margins being high because employee compensation is low, while that makes sense for an individual company acting alone, I don’t think it works across the economy because lower aggregate employee incomes should translate into lower aggregate company revenues, thereby not allowing individual companies to generate more profits. I recommend reading the excellent research put out by the Jerome Levy Forecasting center (particularly their discussion of the fallacy of decomposition).
Hope this helps.
Regards,
Raj
LikeLike
1.) All of the components of national corporate profits are in GNP. That is not the case with GDP. Thus I think they need to be compared to GNP. Doesn’t have a huge effect either way though.
2.) & 3.) My point is that you can’t treat both national corporate profits and domestic corporate profits as relevant. National corporate profits do not include U.S. profits of foreign firms whereas domestic corporate profits do. So basically you are left with a choice. You seem to be choosing domestic as the relevant data set, which means you give up total. But the whole story in my mind is about foreign. And I think total is relevant as well, as would everyone from Buffett to Grantham. Thus I adjusted domestic. I understand why you want to look at unadjusted domestic, but I look at my adjusted domestic as more relevant when thinking about the stock market. And I consider the adjusted domestic number to be in the same fight for pie, whether pie is going to labor or foreign firms with U.S. operations or whatever. It is still a fight regardless of the source. Both (adj. and unadj. domestic) will have a mean reversion component as you can only eat into so much employee comp, taxes, net interest, etc. The fact is, one should look at both. I just find my adj. domestic more relevant when thinking about the stock market.
4.) It is a decent size range. But I think for one to say things are crazy, it needs to fall outside the range. Within the range things can be classified as within reason. And adj. domestic is within range now, while unadj. domestic is just outside of range. To understand where adj. domestic falls in the range, you have to do some thinking about effective tax rates, interest rates, the labor market, etc., which you have done. That is why we are towards the high end of the range. Anyone doing calculations assuming instant mean reversion I think are totally wrong because they aren’t taking those numerous factors into consideration. And if they are assuming foreign profits mean revert, I think they are even more wrong. Some are taking current revenue and then assigning a mean reverted profit margin to come up with what earnings should be, then assigning some mid point multiple that doesn’t take historically low interest rates into consideration. This is ludicrous.
5.) Credit Suisse did a pretty in depth analysis of the situation and they are saying 50% of the increased margin is attributed to lower interest rates. Take a look at the second link I provided below to see how employee comp and the national debt have helped increase corporate profits as well. You have to think in terms of pie. Total spending = national income + taxes. Our deficit spending, which is enabled by massive money printing, is keeping total spending up. And thus GDP/GNP is up. And thus ‘national income + taxes’ are up. And then it is a fight for who gets what of that pie. And if net interest is way down and effective taxes are way down and employee comp has been coming down, there is just more left for corporate profits. I think that is a better way of thinking of things. Instead, people want to look at profit margins. I think that leads people astray. They view a simplistic world where people move sale prices around to hit certain net profit numbers. It just doesn’t work that way. The real world is much more complicated. For one, margins vary drastically for different industries. And second, the price is a number that can’t be played with too much. You move your prices up too much relative to your competitors and it is game over. The profit margin story is a story about expense mgmt more than anything. I think you can see where I am going with it, so I won’t explain it in depth.
Additional: Unless the labor market deteriorates further (unlikely), effective tax rates come down further (unlikely) or interest rates come down further (not much room for that at this point), the corporate profit to GDP/GNP ratio is basically tapped out (I presume foreign will have trouble growing much). Our economy is unlikely to grow at much more than 2% real (1.25% productivity + 0.75% pop growth) or 4% nominal (+2% inflation) on avg. for some time. That will swing based on inventory build, what is happening in the broken private credit market, etc., but it should avg. around those amounts until (if?) Bernanke gets the private credit cycle going again so we don’t have to rely on deficit spending and money printing. And since you had profit margins increasing over the last few years, earnings could grow at a higher rate compared to topline growth, which led to the market moving up so much. Now that the increase in profit margins is nearly tapped, earnings should now grow more in line with topline. And thus the market should theoretically start going sideways or slightly increase each year. Think square root sign. Now the markets may continue to move up despite lack of earnings growth, but then would be likely to fall back to present levels. Other things would drive that including psychology and how global risks are perceived. But if you presume the market should be correlated with earnings, then we are near topping out (or slow minimal increase from here). As an aside, China’s stock market hasn’t gone anywhere for a decade despite massive GDP growth because profits haven’t followed growth. There are reasons for this I won’t get into.
Bernanke is pumping up excess reserves (nearly $2 trillion now), and I believe he is going to try to blow them all out into the economy to restart the private credit cycle. He’ll drop the IOER rate from 0.25% to 0.0%, or maybe he needs to take it negative. This will force all the excess reserves back onto bank’s balance sheets where they will need to either put it to work or watch their ROEs/ROAs drop. I think they will loosen credit standards and put it to work. I think Bernanke starts to move up interest rates to create demand. Most people think it will hurt demand. I disagree. Moving up rates will cause people to act before it’s too late since they might never see these low rates again. Bernanke will wait for the housing inventory to decrease to a normal level before doing all this (we aren’t too far off now) so increased demand leads to more drastic increases in home prices leading to a wealth effect. If this all happens, private investment jumps back to historical levels or higher, GDP can grow at more than 2% real / 4% nominal as credit drives higher growth, unemployment will come down, incomes go up as the pie increases and we start growing out of our debt problem. The deficit would start to close as tax revenues increase, etc. Inflation will start moving up as the GDP gap / output gap closes and productivity starts moving towards capacity. This will lead to even higher nominal growth, which is great for our debt problem. Although if interest rates move up too quickly (I don’t think they will), that could be a setback. Nominal growth has to remain above total avg. interest rate in the economy for us to naturally deleverage. If Bernanke restarts the private credit cycle, things will look good. He will hold onto the securities the Fed holds now, and sell them off when the economy overheats over the next 10 or 20 years as a new form of tightening. Now all this would cause profit margins to come down, but aggregate earnings would go up. This is the grand experiment Bernanke is trying to pull off and I don’t think I have seen a single person lay it out like this. Certainly the Bill Gross’s of the world understand it though. Not sure why he doesn’t discuss it. And it may not happen very smoothly. Could get very rocky, but I think Bernanke will go slowly. The EU already tried dropping the IOER rate to 0% to spark private credit creation, but things are so jacked up over there that it isn’t doing anything. Things are much different here though. I really think we have a chance that it will work. If not, look out below.
LikeLike
1. My approach is to decide first whether GDP or GNP makes the best proxy for the US economy (since we are discussing the effect of macro factors on profits within the US economy). I believe it makes more sense to use GDP because GNP introduces production in other economies. I haven’t crunched the #s on GNP, so this may be more a theoretical point.
2. & 3. My framework is to isolate the actual profit margins in the US economy, and then apply this knowledge along with other factors to the stock market. When thinking about profit margins in the US economy, I don’t think it should matter who owns the means of production. After all, most publicly traded US companies also have foreign shareholders.
We may have different approaches to this. I don’t fully understand your analysis but (without having given it deep thought) I think it might underestimate profits over time since you seem to be backing out a growing figure (per my chart 1). Rather than debate it here, perhaps you can write up your analysis as a guest post and that way everyone can scrutinize it.
4. Fair enough. Different people will have different interpretations here. I’m not actually making any predictions in my article. Since I am in essence disputing the numbers put out by others (i.e., profits being 70% elevated), I felt it made sense to quantify what my own analysis potentially shows. But I noted that the actual extent and pace of any mean reversion will depend on a host of factors (such as those discussed by you).
5. I would be interested in seeing the Credit Suisse analysis you reference.
Thanks,
Raj
LikeLike
Pgs. 23 & 24
https://www.google.com/url?sa=t&rct=j&q=&esrc=s&source=web&cd=4&cad=rja&ved=0CEEQFjAD&url=https%3A%2F%2Fresearch-and-analytics.csfb.com%2FdocView%3Fdocid%3DI8cPzk&ei=mI6NUYGAL9DO0QG0r4DAAw&usg=AFQjCNHSg3FvCS2JdNY9WVty87XiGTD76w&sig2=mtpJ1yzUH3MPwN13WfEr9g&bvm=bv.46340616,d.dmQ
http://pragcap.com/credit-suisse-corporate-profit-margins-will-not-decline
http://www.businessinsider.com/credit-suisse-profit-margins-stay-high-2013-3
http://www.businessinsider.com/chart-profit-margins-to-rise-thru-2014-2013-2
LikeLike
Toby, you should take a look at the Credit Suisse report I linked to if you haven’t already. Very thorough analysis. I think it’s much better than what Hussman puts out.
LikeLike
Very interesting report, Jeff. Thanks for sharing. Figure 59 is particularly interesting. I just note a couple things here:
(1) Per CS’s analysis, margins have improved due to reduction in interest charges, which is not exactly the same as interest rates. It’s possible there could have been reductions in net debt balances among the constituent companies also impacting this, along with declining rates. But certainly future direction should correlate with interest rates.
(2) Not sure I agree with how they’ve quantified the impact of each factor in Figure 59. They seem to be comparing changes in pre-tax figures with the change in after-tax income, which isn’t apples-to-apples. If you tax-effect the interest (using the post-1990 rate of 34.4% for both the post-1990 interest and the latest interest), then instead of constituting 50% of the change in net income, it’s more like 33% (which is still high). By my logic, looks like the change in net income was driven as follows: -9% from changes in EBITDA, 33% from changes in interest, 9% from changes in D&A, and 67% from changes in tax rate. So the big driver is tax.
But the larger point that EBITDA margin isn’t really higher than in the past is very interesting. To the extent one thinks companies target after-tax returns on capital, there still could be some mean reversion. And these numbers would include foreign earnings, plus there could be other data issues. But there are data issues in any analysis and this is still quite interesting.
LikeLike
(1) Agreed. Net debt has come down, although this is driven by increased cash positions as corporate credit outstanding is at all time highs according to the Fed Flow of Funds. But the increased cash positions likely aren’t helping net interest that much as interest income is way down due to low rates.
(2) Agreed. And not sure how lack of labor pricing plays into it. I would have thought it would drive higher EBITDA margins, but that doesn’t appear to be the case. Although EBITDA margins for nonfinancials are way up. So I guess financial EBITDA margins are down enough to offset the boon weak labor prices are having on the rest of companies.
I would see mean reversion in the nonfinancial EBITDA margins whenever labor pricing power comes back. But it would require a much healthier economy which would cause financial EBITDA margins to go up, thus offsetting the mean reversion somewhat.
Not sure why no one looks at foreign profits and how they play into all this. I guess it’s just you and me!
LikeLike
On 3.), my point is national and domestic profits are not apples to apples in your chart above. So they can’t both be relevant data sets. You must choose. I choose the national (i.e. the traditional total corporate profits everyone looks at), because I think profits that effect companies on the London Stock Exchange should not be included if you want to use the statistic as a useful gauge of the market. And thus domestic needs to be adjusted by backing out ‘foreign profits from U.S.’ The main point is your data is not apples to apples.
My links above are not working.
Link 1:
http://www.google.com/url?sa=t&rct=j&q=&esrc=s&source=web&cd=1&cad=rja&ved=0CC4QFjAA&url=http%3A%2F%2Fwww.bea.gov%2Fscb%2Fpdf%2F2011%2F03%2520march%2F0311_profits.pdf&ei=v3CBUdzgEKKb2QWkoIHAAg&usg=AFQjCNG7Ce5_pTmM49Okt9xQW6Kf7fUWng&sig2=fSKElpIdGvXPiw_fANH-tA&bvm=bv.45921128,d.b2I
Link 2:
http://www.google.com/url?sa=t&rct=j&q=&esrc=s&source=web&cd=4&ved=0CEAQFjAD&url=http%3A%2F%2Fwww.academyfinancial.org%2F12Conference%2F12Proceedings%2FG4%2520Golob.pdf&ei=LtZ-UYXME4Gy2QW3jIHYAg&usg=AFQjCNETOpAurdxRmf_R8SXGuQzLWdVeRQ&sig2=r_b75YDUBbeBcXvESeduNQ&bvm=bv.45645796,d.b2I&cad=rja
LikeLike
1.) As we discovered two posts ago, corporate profits do need to be compared to GNP, not GDP. It doesn’t really alter the conclusions, but it’s worth noting. A comparison of corporate profits to GNP is apples to apples.
2.) In your bottom chart, national corporate profits minus domestic corporate profits does not equal foreign profits (i.e. foreign profits as calculated on pg. 23 here: http://www.bea.gov/scb/pdf/2011/03%20march/0311_profits.pdf). And thus I believe it is flawed because the domestic number is misleading.
3.) I understand you want to leave ‘foreign profits from U.S.’ in the domestic number even though they are backed out of the national number. But if you want to use this statistic as one of many tools in gauging where the stock market stands, I don’t think profits that effect companies on the London Stock Exchange should be included. They are backed out of national, and they should be backed out of domestic too. And when you compare the national and adjusted domestic to GNP, it is apples to apples.
4.) Assuming corporate profits should be at the midpoint of 4%-6.5% I think is wrong. I think the correct interpretation should be, “as long as domestic corporate profits to GNP remain within that range, they can be viewed as at a reasonable level.” You are bringing a precision to it that I don’t think is warranted. It is like having a point value on the S&P. It needs to be thought about in ranges, and the market should be considered to be at an acceptable valuation if it falls within the range. That is how Graham thought about it.
5.) The main drivers keeping domestic profits at the high end of an acceptable range are effective tax rates, as you said, along with historically low interest rates and 40 yr low employee comp. He is a study that looks at the effects of wages and debt on corporate profits. http://www.academyfinancial.org/12Conference/…/G4%20Golob.pdf
LikeLike
Brilliant post. It provides much food for thought. Thank you.
LikeLike