Update: Now with a log version.
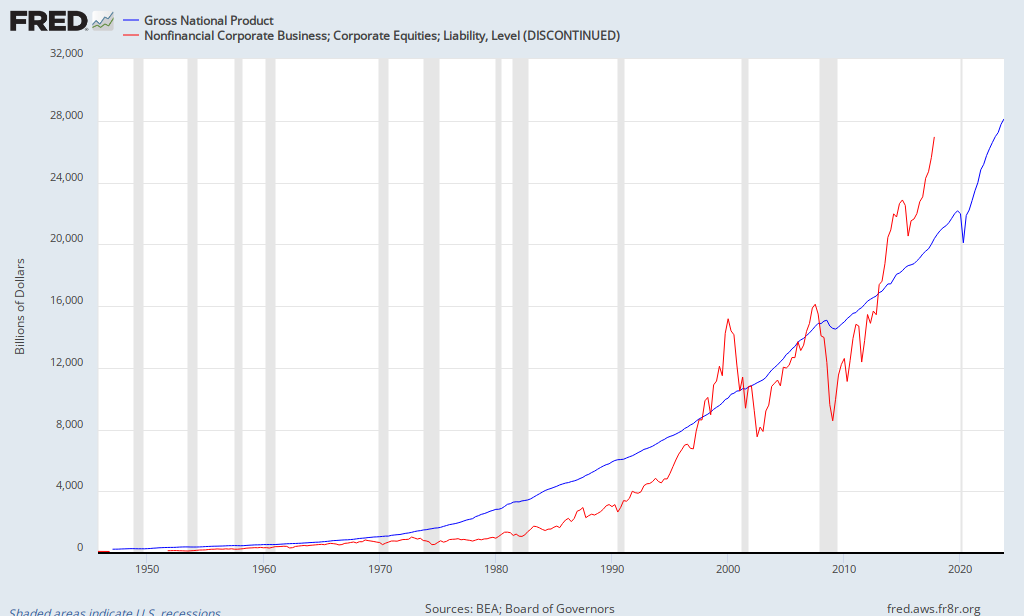
Here’s the St Louis Fed’s FRED on Warren Buffett’s favored market measure, total market capitalization-to-GNP.

According to the FRED data, the Q1 2000 TTM/GNP peak ratio was 158 percent, and the Q3 2007 TTM/GNP peak was 114 percent. The average for the full period – Q3 1949 to Q3 2012 – is 69 percent. The last time the market traded at a below-average ratio was Q1 2009.
Compare this to the Q3 2012 ratio – unfortunately the most recent point – at 100 percent. If we assume ~1 percent GNP growth in Q4 2012 and Q1 2013 (the long-run CAGR is about 1 percent per quarter), and the market has rallied around 10 percent, the ratio now stands at ~107 percent, which is around 40 percent over the long-run mean (since 1949). This level of overvaluation accords with the level of the Shiller PE and Tobin’s q at 40 and 44 percent respectively.
Here’s the log version, per commenter Jim’s request:
Order Quantitative Value from Wiley Finance, Amazon, or Barnes and Noble.
Click here if you’d like to read more on Quantitative Value, or connect with me on LinkedIn.


[…] Market Value-To-Gross National Product, Warren Buffett and John Hussman On The Stock Market, FRED on Buffett’s favored market measure: Total Market Value-to-GNP, The Physics Of Investing In Expensive Markets: How to Apply Simple […]
LikeLike
[…] market value-to-GNP several times. See Warren Buffett and John Hussman On The Stock Market, FRED on Buffett’s favored market measure: Total Market Value-to-GNP, The Physics Of Investing In Expensive Markets: How to Apply Simple […]
LikeLike
[…] the Shiller PE and Buffett’s total market capitalization-to-gross national product measure, the equity q ratio is a poor short-term market timing device. This is because there […]
LikeLike
Questions of a newbie:
Does the GNP (versus GDP) really account for the ‘globalization’ of the US economy? e.g. thinking of Apples huge offshore cash pile.
So does the Cap to GDP ratio (or Cap to GNP ratio) have the same meaning today as it had years or decades ago?
LikeLike
Maybe, maybe not. Correlation between the ratio and subsequent returns has historically been 0.9, which is high. It roughly agrees with the Shiller PE, and Tobin’s q, so that’s some corroboration. The importance of foreign earnings might be increasing, but that shouldn’t impact the Shiller PE or Tobin’s q.
LikeLike
Problems with the Shiller PE:
1. Uses as reported earnings as opposed to operating earnings (S&P’s proprietary adjusted earnings for unusual items; Graham generally excluded unusual items)
2. Using 10 yr avg. earnings makes sense for mature businesses. 10 years generally picks up a business cycle, and thus you get sort of peak and trough earnings over that time frame. So the avg. earnings in that case is a great sort of midpoint to use for earnings power. The problem here is that the U.S. economy is a growing one (6% per year nominally on avg.). So using 10 yr avg. earnings will come up with a misleading number that is too low.
3. Graham understood (as does Buffett) that interest rates effect valuations. Lower interest rates should result in higher valuations due to a lower discount rate, etc. Thus Graham never did a Shiller PE type of analysis for the market like he did with mature stocks. He took 10 yr avg earnings divided by 2x the interest rate for AAA rated bonds.
4. Shockingly enough, that analysis worked better for the ’25 to ’45 time frame, probably because the economy wasn’t growing normally. Yeah, if the economy stays flat over long periods of time that type of analysis will work. But instead, we grow at 6%. Graham understood the calculation wasn’t useful anymore, so by the early ’60s he added an arbitrary 50% to the final result. In my mind, this basically makes up for the growth component. Valuing a value stock and growth stock require a totally different analysis. Buffett has gone over it all in his annual letters. He would think a person is nuts to take 10 yr avg. earnings to come up with earnings power for a growth company.
Using the historical total market cap to GNP ratio is a flawed technique because of globalization and the effects of foreign earnings. Using the Shiller PE is a flawed technique for the reasons stated above. Yes, the two flawed techniques point to the same implied valuation for the stock market. What a coincidence. It’s just flawed and useless.
If you find yourself getting angry over the criticism of both these stock market valuation guides, you should check yourself. There is nothing I have said that is not logical, rational, and better thought through. If you can’t recognize that, then nothing will shake your desire for the market to be valued at what it generally is at the bottom of recessions. We’ll get there, have no fear. Just at the bottom of the next recession.
LikeLike
Oh, and the current Shiller PE is picking up 2008 earnings of $14 in the calculation, which is clearly an outlier and 1 in 75 yr event and Graham would exclude them.
LikeLike
Thank you for your time gentlemen, but I still got no answer. Seems you have no clue either.
LikeLike
” If anything, the reduced number of listed stocks would point to the total market capitalization being overstated,”
If more companies were staying private, wouldn’t that understate the total ‘market cap’ of companies contributing to GNP? What am I missing?
LikeLike
A stock’s market capitalization counts towards the numerator – total market capitalization – not the denominator – gross national product. When a publicly listed company goes private its market capitalization no longer counts towards the numerator – total market capitalization – but its business continues to count towards the denominator – gross national product. As there are fewer public companies now than there were in 2000, the ratio may be understated.
LikeLike
This pales in comparison to the foreign earnings issue though.
LikeLike
GNP includes foreign earnings.
LikeLike
Total market cap includes 15x foreign earnings while they are only picked up dollar for dollar in GNP. Big big difference. Makes all past data before globalization irrelevant. Or it at least needs to be adjusted. If you assume 50% coming from overseas instead of 0% in the 20s, 30s, 40s, etc., then you would need to double the total market cap to GNP ratio back then.
LikeLike
Are foreign earnings treated any differently than domestic earnings? If so, I can your point….but I struggle with why GNP overseas would be different than domestic GNP – hence “national” product.
LikeLike
GNP picks up earnings dollar for dollar. But for the valuation of a company, a multiple is applied. Presume a company has $2.50 of earnings and trades at 15x. Then the stock price is $37.50. Now picture it has additional foreign earnings taking the EPS to $4.00 ($2.50 + $1.50 or 37.5% foreign earnings). With a 15x multiple the stock price is $60. So the implied market cap goes up with the addition of foreign earnings by a multiple.
LikeLike
I understand the math.
I’m saying – why is GNP now, say 50-50 domestic and national earnings, different than GNP in 1950 when it was say 90% domestic and 10% international?
If publicly-traded earnings, domestic or international, make up say 5% of total GNP (with private businesses making up the remainder), and those earnings are valued at 15X, then the fair value market cap to GNP ratio would be 75%.
Whether that 5% is 10% national as in 1950 or 50% national now, the 15X multiple is applied and flows through just the same.
LikeLike
Seriously I want to know. Are foreign earnings treated differently in the GNP calculation than domestic earnings?
LikeLike
In GNP, all earnings are picked up dollar for dollar. In the total market cap calculation, a multiple is applied. Thus, more foreign earnings = higher total market cap to GNP ratio. Makes the historical data useless without adjusting it.
LikeLike
The ratio stays the same.
LikeLike
The ratio does not stay the same. For GNP, foreign earnings are added dollar for dollar. For total market cap, a multiple is applied. Pretty easy concept.
LikeLike
WHY ARE FOREIGN EARNINGS DIFFERENT THAN DOMESTIC?????
Your argument implies something along the lines of….domestic sales are included in GNP whereas foreign earnings are included.
Please answer the question and stop using the multiple example, which makes zero sense.
LikeLike
They are not different Joe. They are the same. All earnings are picked up dollar for dollar, foreign or domestic. The difference is that up until about 1990, there weren’t much foreign earnings in the S&P numbers at all. So when you look at any historical data before that, it isn’t an apples to apples comparison.
LikeLike
You obviously did not follow my original point. If corporate profits are the same percent of GNP as fifty years ago, but the composition of those earnings is now more heavily weighted toward foreign, your point is entirely moot.
LikeLike
Oh, I understood your point. You don’t understand the additive nature of foreign earnings though. You want to take 1928 earnings let’s say, and just assume that the earnings for that year should be adjusted 50%/50% domestic vs foreign. That is now how the adjustment should be made. The adjustment is to ADD foreign earnings such that the resulting ratio is 50%/50%. This means you have to DOUBLE earnings.
LikeLike
Gents, you can look at the data on the FRED website. GNP and GDP are almost identical, and have been since the data started in 1947. Here’s a log chart comparing GNP and GDP going back to 1947.
LikeLike
Not sure what your point is. What we do know is that foreign earnings make up something like 45%-50% of S&P earnings now vs none prior to 1990.
As an example, $100 billion of additional foreign earnings isn’t going to have much effect on a GNP/GDP number that is already in the trillions. But for total market cap, $100 billion of foreign earnings add about $1.5 trillion to that number. That does have a big effect on the ratio.
LikeLike
GNP was $16.1 trillion in 2012.
As of 2/28/13 the Wilshire full cap was $18.3 trillion and had a median PE of 18.3, which means Wilshire profits were $1 billion a trailing twelve month basis.
That means Wilshire LTM profits are 6.2% of 2012 GNP.
Let’s say for example the Wilshire is fairly valued at 15X earnings, or $15 trillion. That means the fair value Wilshire/GNP ratio is 93% (not saying this is the actual fair value – just using it for illustrative purposes).
Now let’s say GNP has grown at 6% nominally for the past 50 years – simple math says GNP was $874 billion 50 years ago. If Wilshire profits were 6.2% of GNP 50 years ago, then corporate profits were $54 billion. Again, say the Wilshire was fairly valued at 15 times those earnings – that means the fair value Wilshire/GNP ratio was 93%.
For the love of mike, please explain why the fact that the 6.2% of GNP Wilshire profit ratio should be adjusted just b/c 50% of it is now internationally sourced?
You have to make the case – which you have not even remotely done – that corporate profits as a percentage of GNP are sustainably higher now than they was 50 years ago due to international profitability.
And please remember that GNP does not comprise solely publicly-traded profits. So for you to make any sense, you must show precisely why corporate international profits are the ONLY PROFITS THAT HAVE RISEN SINCE 50 YEARS AGO. If publicly-traded international corporate profits have gone up in 50 years, wouldn’t it only make sense that non-publicly-traded international corporate profits have risen as well, thus rendering the publicly-traded corporate profit % of GNP the same as it was 50 years ago?????
LikeLike
Is there a way to adjust this for the changing mix of public/private company ownership? If SOX compliance or some other factor was causing companies to delay IPO, float in another country or go private (or a different factor like “free” dotcom money drove up public ownership), that would change the size of the signal that TMC:GNP was sending.
If you do the thought experiment where valuations etc. remain identical but (say) someone turns up at the NYSE and drops $1.5T in a helicopter to take MSFT, AAPL, XOM, IBM private then there goes $1.5T from one side of the ratio. Total stock market capitalization drops ~10% so the ratio changes but GNP wouldn’t be affected.
LikeLike
That’s a potential issue, and I do think it’s due to SOX compliance (see my old post here on SarbOx). One way to examine it would be to look at the number of publicly listed companies in the Wilshire 5000. At year-end, the Wilshire 5000 had 3,687 stocks (not 5,000). There are fewer public companies today than there were in at the peak in 2000 (6,639 – See USAToday). If anything, the reduced number of listed stocks would point to the total market capitalization being overstated, suggesting that the presently elevated TMC/GNP ratio might be understated. Noting, however, that the current ratio roughly agrees with the Shiller PE and Tobin’s q might suggest that it’s roughly accurate.
LikeLike
The total market cap to GNP before 1990 is not very useful. Something like 40%-50% of S&P earnings now come from overseas. This justifies a higher ratio as the total market cap would be higher while GNP would not be affected. Buffett realizes this, and I know I’ve heard him say the past ratios are not applicable. He has also come out and publicly said 80% is a low point for the ratio and a time to buy. I think the appropriate range should be 80% to 100%.
LikeLike
GNP includes earnings from overseas.
LikeLike
I was thinking GDP. Buffett wrote his Buy America op-ed when the ratio was around 80%. He viewed that as a once in a generation buy level. Do you really think the correct ratio should be 69%? Whereas Buffett viewed 80% as a sensible trough, you view 69% as the appropriate midpoint. I think the correct range should be 80% to 100%. Or 75% to 95%.
You already saw the adjustments Graham made to the Shiller PE type of analysis.
LikeLike
GNP picks up those foreign earnings dollar for dollar, while the total market cap is picking them up at 15x. Thus more foreign earnings results in a higher ratio.
Buffett said in a 2001 Fortune article, “For me, the message of that chart is this: If the percentage relationship falls to the 70% or 80% area, buying stocks is likely to work very well for you. If the ratio approaches 200%–as it did in 1999 and a part of 2000–you are playing with fire. As you can see, the ratio was recently 133%.”
Gurufocus provides a lot of detail and analysis on the ratio here: http://www.gurufocus.com/stock-market-valuations.php
I think the evidence points to a midpoint of 69% as being ultra conservative. The ratio barely dipped below that at the bottom of the Great Recession (it probably wasn’t below it for more than a month) and it actually didn’t get down that low after the tech bubble popped. But you think it is an appropriate midpoint. Just doesn’t make sense. You think the market should have a valuation near what it was at the bottoms of the last two recessions.
LikeLike
Would like to see a log plot
LikeLike
Now with a log version. Data stops in Q3 2012, unfortunately, so the current peak is missing.
LikeLike