In How to Beat The Little Book That Beats The Market: Redux (and Part 2) I showed how in Quantitative Value we tested Joel Greenblatt’s Magic Formula outlined in The Little Book That (Still) Beats the Market).
We created a generic, academic alternative to the Magic Formula that we call “Quality and Price,” that substituted for EBIT/TEV as its price measure the classic measure in finance literature – book value-to-market capitalization (BM):
BM = Book Value / Market Price
Quality and Price substitutes for ROIC a quality measure called gross profitability to total assets (GPA). GPA is defined as follows:
GPA = (Revenue − Cost of Goods Sold) / Total Assets
Like the Magic Formula, it seeks to identify the best combination of high quality and low price. The difference is that Quality and Price substitutes different measures for the quality and price factors. There are reasonable arguments for adopting the measures used in Quality and Price over those used in the Magic Formula, but it’s not an unambiguously more logical approach than the Magic Formula. Whether one combination of measures is better than any other ultimately depends here on their relative performance. So how does Quality and Price stack up against the Magic Formula?
Here are the results of our study comparing the Magic Formula and Quality and Price strategies for the period from 1964 to 2011. Figure 2.5 from the book shows the cumulative performance of the Magic Formula and the Quality and Price strategies for the period 1964 to 2011.
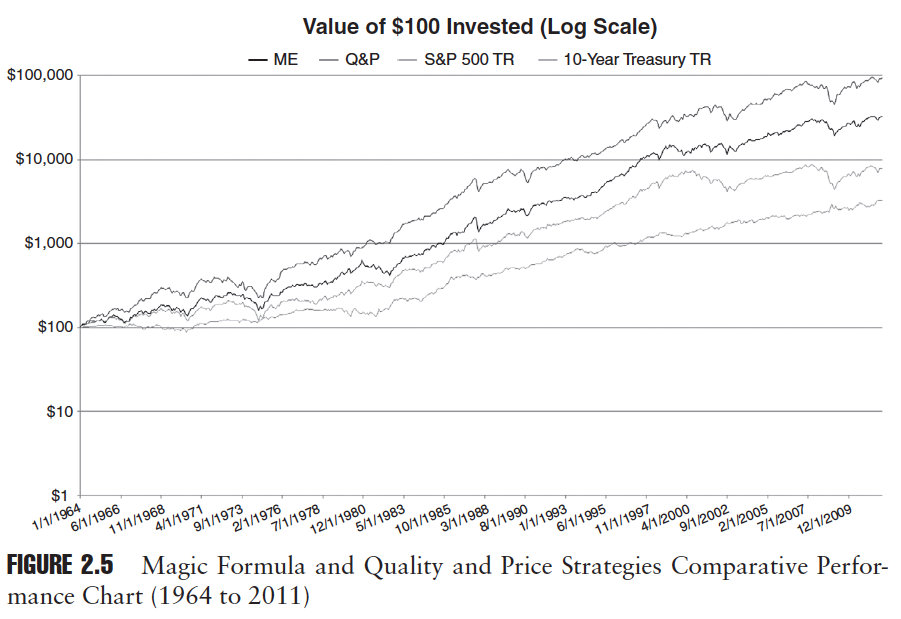
Quality and Price handily outpaces the Magic Formula, turning $100 invested on January 1, 1964, into $93,135 by December 31, 2011, which represents an average yearly compound rate of return of 15.31 percent. The Magic Formula turned $100 invested on January 1, 1964, into $32,313 by December 31, 2011, which represents a CAGR of 12.79 percent. As we discuss in detail in the book, while much improved, Quality and Price is not a perfect strategy: the better returns are attended by higher volatility and worse drawdowns. Even so, on risk-adjusted basis, Quality and Price is the winner.
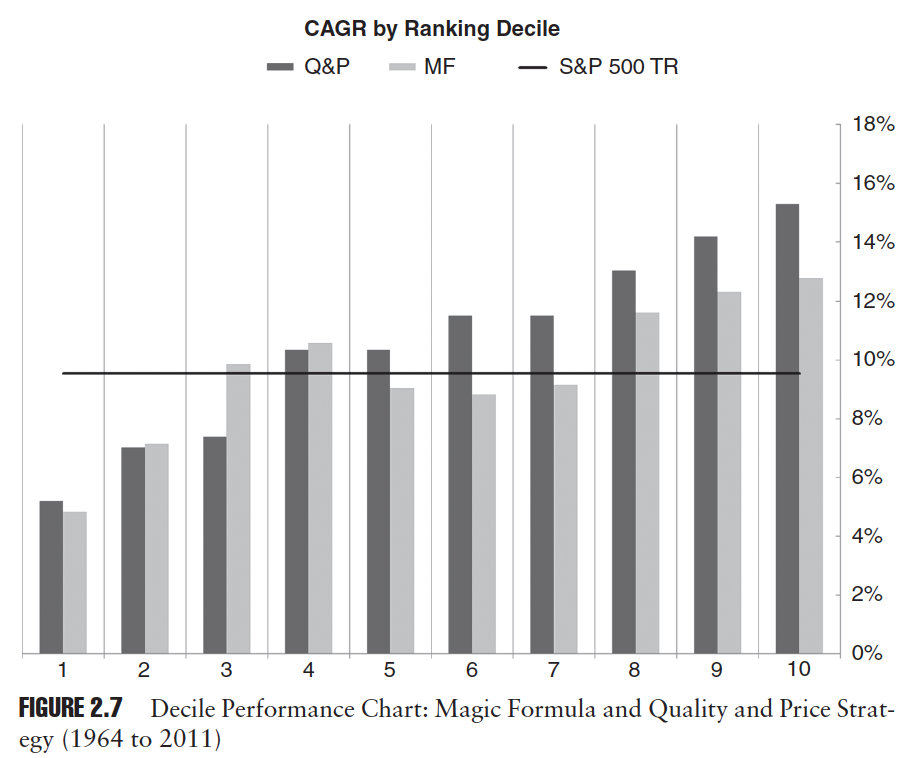
Figure 2.7 shows the performance of each decile ranked according to the Magic Formula and Quality and Price for the period 1964 to 2011. Both strategies do a respectable job separating the better performed stocks from the poor performers.
This brief examination of the Magic Formula and its generic academic brother Quality and Price, shows that analyzing stocks along price and quality contours can produce market-beating results. This is not to say that our Quality and Price strategy is the best strategy. Far from it. Even in Quality and Price, the techniques used to identify price and quality are crude. More sophisticated measures exist.
At heart, we are value investors, and there are a multitude of metrics used by value investors to find low prices and high quality. We want to know whether there are other, more predictive price and quality metrics than those used by Magic Formula and Quality and Price.
In Quantitative Value, we conduct an examination into existing industry and academic research into a variety of fundamental value investing methods, and simple quantitative value investment strategies. We then independently backtest each method, and strategy, and combine the best into a new quantitative value investment model.
Order from Quantitative Value from Wiley Finance, Amazon, or Barnes and Noble.
Click here if you’d like to read more on Quantitative Value, or connect with me on LinkedIn.


[…] the How to beat The Little Book That Beats The Market (Part 1 2, and 3) series of posts I showed how in Quantitative Value we tested Joel Greenblatt’s Magic Formula […]
LikeLike
Love your work Toby!
Couple questions…
– This is the same method as the Novy-Marx paper, when he does a composite ranking of GP/A and B/M, yes?
– In your version, do you exclude financials and real estate? I find it difficult to *fully* appreciate additions to a basic value method, when those additions don’t take into account all manner of industries. For example, I know an Aussie educator who excludes all the resource companies that we have here. Doesn’t make sense to me. I think that O’Shaughnessy and Dreman show (in different) ways that basic, relative value works – for financials, resource companies (or “materials” sector) and real estate alike.
The GP/A can’t be used with financials however, as they don’t have revenue & COGS. So I assume you have excluded them. Does that frustrate you like it does me? :-)
– Lastly, in relation to some of the preceding comments about the small cap effect; what do you make of the Australian markets’ seeming opposite performance to the US experience in the size effect? What I mean here is, according to all research I have seen, value (and momentum for that matter) is stronger in the larger caps here. For me, that weakens my (global) acceptance of a size effect. Value (and momentum) are anomalies. Maybe volatility, too. Size? Perhaps “Does Size Matter?” could be a worthy blog post?
Cheers!
LikeLike
Thanks, Steve. Novy-Marx excludes financials, as do we. He tests the largest 500 non-financial companies.
I’ve seen some research from O’Shaughnessy that there’s less to the small cap effect than meets the eye. He says the bulk of the return comes from micro-cap stocks that are uninvestable. From a Kipplinger’s article:
LikeLike
Hi Toby,
Love your blog. I followed both yours and Wes’ blogs for close to two years now and I liked all the posts you did about MF (especially the synthesis you made in May 2012). One thing I always found disturbing is how different Wes’ backtesting results from the little book that beaks the market – for both small and large caps results from his old website and the ones that you put up in the graph here.
I am comsidering buying your book but was curious if the book tried to explain the difference as well as the level of details that is provided on the backtesting methodology itself.
Thanks
LikeLike
Thanks Toby for all your work.
LikeLike
My pleasure. Thanks, Al.
LikeLike
Tobias,
I appreciate your point and ability to prove a theoretical model. In Turnkey Analyst, would you consider listing 15 stocks with a lower market cap (and sufficient average daily volume) to benefit your “average” reader? Many thanks.
LikeLike
TurnkeyAnalyst is Wes’s site, so you need to direct your inquiries to him.
LikeLike
If I could interject, Wesley Gray has responded to this question previously. Basically, that’s the type of information that clients of Toby and Wesley pay for. They have to make a living, as well all do :-).
LikeLike
Toby, that may well be the case for an institutional investor. However, the average reader of this blog is …………….. average!! For regular Joe, a market cap of 250m+ or perhaps 500m+ would ensure replicability in the real world together with a higher return. Another precaution may be to keep average daily volume higher than 50,000. If this results in 2% points of higher return, it compounds to big money over the years. Please do consider lowering the bar below $1.4 billion since any edge should be exploited. By the way, I loved your book :)
LikeLike
Al,
Our objective was to demonstrate that a quantitative approach to value investing can work. If we demonstrate it using illiquid micro-caps then we’ve demonstrated that low liquidity and small capitalization stocks outperform, which everyone already knows, but we’ve shown nothing about our quantitative value metrics. It’s much harder to generate returns in the universe above the NYSE40% cutoff. Effects that we see in stocks over the NYSE40% cutoff will work below the cutoff, but not necessarily vice versa. The returns in the universe we’ve tested are more likely to be achievable than similar returns shown in a smaller capitalization universe.
Toby
LikeLike
Have you thought of using micro-cap stocks (market cap 50m-250m) or at least small caps? These are perfect for the regular investor (average daily volume 25,000+ is liquid enough) and provide a method of beating the institutional big guns. In fact there is research showing that low liquidity beats the market, along with the size anomaly.
Thanks
Al
LikeLike
By limiting our universe to stocks with a market capitalization greater than $1.4 billion (as at December 31, 2011) the returns to our strategy will be reduced compared to the returns to other strategies that include smaller stocks. By including smaller stocks we’d find higher returns. We don’t do that because those returns are unlikely to be replicable in the real world.
LikeLike
As a retail investor, I have found microcap stocks difficult to trade at times. But small cap stocks (market cap greater than 300 million) aren’t that difficult; the bid ask spread isn’t that bad.
James O’Shaughnessy also excludes smaller cap stocks in his analyses, but his lower limit is $200 million. And in some of his momentum analyses, he uses a lower limit of $50 million.
DFA’s Microcap Fund has an average market cap of $540 million, which really makes it a small cap fund. But it also has $3.9 billion in assets.
If DFA can successfully invest in small caps, I’m not certain why a retail investor, with a portfolio 10,000 times less than DFA’s, can’t.
If there is evidence against what I say, I would be very interested in hearing it.
LikeLike
I’m not saying small investors can’t invest in the small cap universe, I’m saying that backtested returns found in a small capitalization universe are unlikely to be achievable in reality on the same scale as the backtest.
LikeLike
Al, Ray and myself basically all have the same question. Your answer is very reasonable.
LikeLike
Can you expand upon your statement that if smaller stocks are included that it is unlikely to be replicable in the real world?
LikeLike
Ray,
What I mean is that theoretical, backtested returns found in a small capitalization universe are difficult to replicate in the real world. Small capitalization stocks generate huge returns, mostly due to the smallest of the small, most of which are uninvestable. The more difficult task is demonstrating returns in a large capitalization universe. Effects that we see in stocks over the NYSE40% cutoff will work below the cutoff, but not necessarily vice versa. The returns in the universe we’ve tested are more likely to be achievable than similar returns shown in a smaller capitalization universe.
Toby
LikeLike