Butler|Philbrick|Gordillo and Associates’ argue in Valuation Based Equity Market Forecasts – Q1 2013 Update that “there is substantial value in applying simple statistical models to discover average estimates of what the future may hold over meaningful investment horizons (10+ years), while acknowledging the wide range of possibilities that exist around these averages.”
Butler|Philbrick|Gordillo use linear regression to examine several variations of the Shiller PE (and other cyclically adjusted PE ratios over periods ranging from one to 30 years), Tobin’s q ratio and Buffett’s total market capitalization-to-gross national product ratio (“TMC/GNP”). They have analyzed the power of each measure to explain inflation-adjusted stock returns including reinvested dividends over subsequent multi-year periods, setting their findings out in the following matrix:
Matrix 1. Explanatory power of valuation/future returns relationships
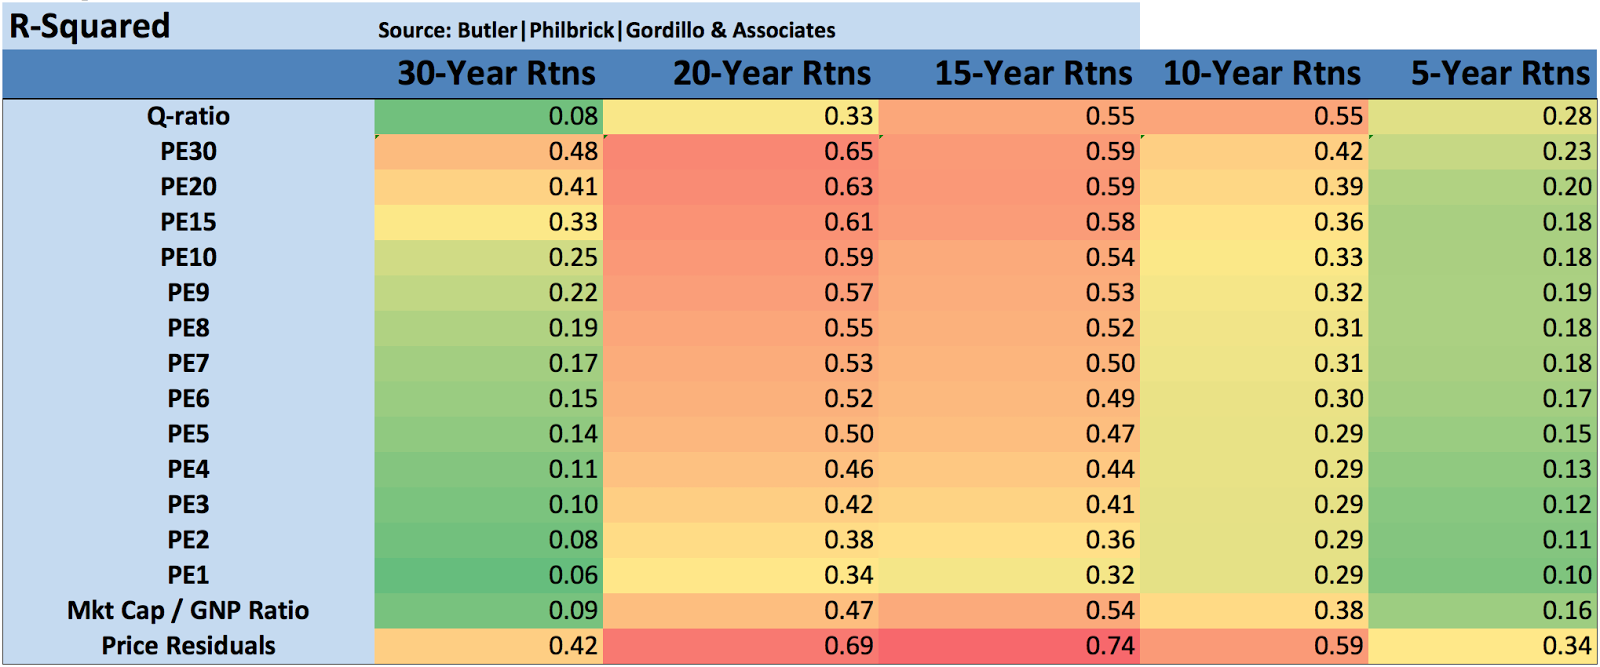
Matrix 1. contains a few important observations. Notably, over periods of 10-20 years, the Q ratio, very long-term smoothed PE ratios, and market capitalization / GNP ratios are equally explanatory, with R-Squared ratios around 55%. The best estimate (perhaps tautologically given the derivation) is derived from the price residuals, which simply quantify how extended prices are above or below their long-term trend.The worst estimates are those derived from trailing 12-month PE ratios (PE1 in Matrix 1 above). Many analysts quote ‘Trailing 12-Months’ or TTM PE ratios for the market as a tool to assess whether markets are cheap or expensive. If you hear an analyst quoting the market’s PE ratio, odds are they are referring to this TTM number. Our analysis slightly modifies this measure by averaging the PE over the prior 12 months rather than using trailing cumulative earnings through the current month, but this change does not substantially alter the results.As it turns out, TTM (or PE1) Price/Earnings ratios offer the least information about subsequent returns relative to all of the other metrics in our sample. As a result, investors should be extremely skeptical of conclusions about market return prospects presented by analysts who justify their forecasts based on trailing 12-month ratios.
Butler|Philbrick|Gordillo note:
Our analysis provides compelling evidence that future returns will be lower when starting valuations are high, and that returns will be higher in periods where starting valuations are low.
So where are we now? Table 1 below from the post provides a snapshot of some of the results from Butler|Philbrick|Gordillo’s analysis. The table shows estimated future returns based on an aggregation of several factor models over some important investment horizons:

Source: Shiller (2013), DShort.com (2013), Chris Turner (2013), World Exchange Forum (2013), Federal Reserve (2013), Butler|Philbrick|Gordillo & Associates (2013)
You can see from the table that, according to a model that incorporates valuation estimates from 4 distinct domains, and which explains over 80% of historical returns since 1871, stocks are likely to deliver 1% or less in real total returns over the next 5 to 20 years. Yikes.
They conclude:
[T]he physics of investing in expensive markets is that, at some point in the future, perhaps years from now, the market has a very high probability of trading back below current prices; perhaps far below.
The post is a well-researched, and comprehensive analysis of several long-term market-level valuation measures. It is a worthy contribution to the research in this area. Read Valuation Based Equity Market Forecasts – Q1 2013 Update.
Order Quantitative Value from Wiley Finance, Amazon, or Barnes and Noble.
Click here if you’d like to read more on Quantitative Value, or connect with me on LinkedIn.


[…] For more on market value-to-GNP see my earlier posts Warren Buffett Talks… Total Market Value-To-Gross National Product, Warren Buffett and John Hussman On The Stock Market, FRED on Buffett’s favored market measure: Total Market Value-to-GNP, The Physics Of Investing In Expensive Markets: How to Apply Simple Statistical Models. […]
LikeLike
[…] capitalization-to-gross national product, and the equity q ratio, all three examined together in The Physics Of Investing In Expensive Markets: How to Apply Simple Statistical Models). Hussman says in relation to the chart […]
LikeLike
[…] Chris Turner has a guest post at Doug Short’s Advisor Perspectives called When Warren Buffett Talks … People Listen examining Warren Buffett’s favored market valuation metric: Market Value divided by Gross National Product. (I’ve also examined market value-to-GNP several times. See Warren Buffett and John Hussman On The Stock Market, FRED on Buffett’s favored market measure: Total Market Value-to-GNP, The Physics Of Investing In Expensive Markets: How to Apply Simple Statistical Models) […]
LikeLike
Do you guys want to bet this? I am willing to make a substantial bet on the over. I love bad analysis and trying to profit from it, but I find that the propagators of it never want to actually put their money behind their outlandish predictions and wager on it. Good way to try to get known is to put out outlier data and, if on the low chance it comes true, the propator becomes well known for predicting the unlikely. Lol!
LikeLike
Mark
Here is the thing – you just come on here challenging people with nothing to back it up? What is YOUR model if you want to critique mine?
I’ve presented my buffet-quotient multi-factor model that takes into account Buffet’s blessing on the market in the maths. (yes or no buffet quotient with TobinsQ and Shiller)
Greenbacked presented TobinsQ and Shiller PE – to me they are kinda irrelevant alone since they don’t take into account Buffet’s thoughts in the maths. In this sense Carlise is like a value investing athiest. That’s okay – at least its a model even though he doesn’t build in any buffetology.
It was brought up that both these models could be improved by adjusting them by the price of copper which I think is obvious.
What is your framework Mr. fancy pants? You don’t have one. From where I come we call someone like you a chicken-doo doo.
LikeLike
Jarry, your analysis is internally inconsistent, subjective and not really quantitative. There’s just one problem. It’s also kind of brilliant.
In a sense, it’s more rigorous than other analysis presented here because Buffett has such an incredible track record. In Medieval times, people referred to God as “sui generis” (i.e. God is his own cause). In a similar vein, Buffett is his own backtest.
I don’t mean to suggest he’s actually God or anything silly like that–just that his general philosophy is an amalgamation of concepts like the Shiller P/E and persistence of Quality, etc. And as a result, it can be sort of relied on (like them). People will argue that you have to backtest each piece of philosophy to know whether the whole works, but I say that’s sort of like breaking Michael Jordan’s performance in a basketball game down to each tiny movement.
By the way, regardless of which currency or commodity you use, Buffett’s results are simply miraculous.
I know I’m beating a dead horse here a bit, but I guess I feel like denominating results in the US Dollar is a bit arbitrary and–to be blunt–also a bit ethno-centric.
LikeLike
I am willing to back up my views with dollars in a wager, which evidently you are not willing to do. I simply pointed out that you have failed to engage in the same analysis that Buffett did in the article that you quoted him. Buffett apparently agrees with me and not you. I also have pointed out some of the errors. Mainly, I evaluate many individual companies and reach my conclusions from the bottom up, and also consider top down data. I feel no need and have no desire to write out a full scale analysis.
You can find plenty of guys doing full scale analysis who disagree with you.
Here is a guy who disagrees with you, although his presentation in this cite does not appear to be a full scale analysis, I am guessing he either has done one or is happy to provide you with one. http://www.saipus.com/docs/Hillcrest_Commentary_Q4_2012.pdf
I don’t necessarily fully agree with him or any others but I believe he is much more correct that you.
LikeLike
samuelfactory,
All good suggestions for follow-up work.
Please note that we did run a multiple regression analysis on all of the factors (please see the original study); it turns out that the Shiller PE is collinear with the other metrics, and also statistically insignificant, so we excluded it. The results of the multiple regression are at the bottom of Matrix 4, though we did not include MV ANOVA stats, which would have been useful.
Thanks again for your constructive comments.
Adam
LikeLike
I think it’s important to look at a Buffet coefficient – meaning whatever Buffet thinks. Buffet says he is bullish on America and how can you quantify that in a risk-parity framework? It’s harder than misleading signals like Tobins Q. So if I were running a market valuation model I would take Shiller’s PE , Tobins Q, and the Buffet Coefficient and run them concurrently in a multi-factor model. The fact that Buffet is bullish outweighs boths the TobinsQ and Shiller in the mathematics. Did you see my point? One day I will publish my research on this but for the time being I am bullish too and will be until the Buffet coefficient says otherwise.
LikeLike
I think you’re being satirical. I apologize for ruining the joke if you are, but you’ll find that exact sentiment in the comment section of many posts on this site, so you’ll have to excuse my joke-blindness. If you’re being serious, then you’re in good company.
LikeLike
I have no interest in arguing with you. i already pointed out the flaws, but you have no interest in learning from them.
Howabout this, since you are so sure of your conclusions, how about wagering on them? I would happily take the over on your conclusions of the future returns. I would much prefer to wager (and profit) from your misguided conclusions than argue with you about them, since it is clear you are wedded to them.
LikeLike
Rufus – your proposition is worth consideration on numerous fronts of the investment frontier.
Weidman – It may be ironic to you but I bet that the buffet coefficient (1= buffet is bullish, 0 = buffet is not) used in a multi-factor model (with or without copper price adjustment per research below) with Tobins Q and Shiller’s PE is mathematically and risk adjustedly superior to whatever Buffet-signal model you are using.
Value investing is pretty easy but you have to be smart about it. See my point.
LikeLike
Mr. Weidmann, what is the valuation scheme you’re proposing? Was it in an earlier post? Is there a running discussion on here I’m not aware of?
LikeLike
I think the analytic framework laid out by Buffett in the article he wrote that is cited is a good one. Unfortunately, although it was cited, it was not followed, instead it was truncated to focus on mainly one variable, without an analysis of the context.
The best way I can think of is to evaluate each and every company, make an estimate of its value and compare it to its market cap. One can shorten this task by using appropriate statistical methods to select a random sampling of companies on which to perform this exercise and then extrapolate.
Personally, I believe it is a mistake to focus too much on one’s view of the overall valuation of the stock market, precisely because it is a difficult evaluation to make and prone to error. Of course, when the overvaluation is to the degree that occurred in 1999, it was pretty obvious, at least to me, and I didn’t need any formulaic way to figure that out.
A better strategy is to select individual securtiies one believes are undervalued. If one can’t do that, then best to follow Benjamin Graham’s advice to passive investors that he wrote in the Intelligent Investor.
LikeLike
Jarry:
Perhaps I would get your point if you stated in a way that I could make sense of. I am familiar with the finance world’s method of “risk adjusted” returns, and I find it to be complete and utter gibberish. Generally, any finance terms represented by a greek symbol, alpha and beta and so on, are complete garbage, in my opinion.
Value investing is tautologous, as I don’t believe there is any other method of investing. I wouldn’t call the other methods, investing.
I certainly haven’t had any problems “value investing” and a great many other people haven’t had any problems doing it, either.
LikeLike
Jarry, intuitively perhaps there is something here. But there’s one problem. Your analysis needs to adjust for the price of gold or–even better–for the price of copper.
LikeLike
samuelfactory,
Thanks for your comment.
As the author of the original study, I can confirm that the overlapping periods under consideration do weaken the statistical significance of the estimates. This is unavoidable unfortunately given that there are only so many independent 15 or 20 year periods over the past 140 years.
However, the estimates are clearly better than those offered by long-term averages, and many of the other poorly founded analyses found elsewhere (especially TTM). Further, the fact that valuation estimates derived from 4 distinct domains all point in the same direction is strong validation.
Thanks and cheers,
Adam
LikeLike
Adam,
Thank you for your reply but I’m not sure if I can concur with your assessment. The model result(s) were already quite insignificant without the adjustment for serial correlation with the errors. In addition, saying that the results are still valid since the all give the same conclusion isn’t applicable as they may be correlated. In addition, if you do think that jointly their results validate your argument, why not a multi-variate regression?
Please understand, in no way am I criticizing your research simply because it offers a premise that violates my viewpoint(s): I’m a ‘perma-bear’ and think equity markets are, by-in-large, ALWAYS over-valued. I’m just encouraging a little more rigor as it will put your analysis head-and-shoulders above a lot of the other ‘quant’ research bandied about the internet. So again, thank you for the informative research and I hope you have continued success.
Cheers,
Robert T. Samuel III
LikeLike
If they are performing the regression(s) in the format I suspect, then there is a high probability that the residuals are correlated and therefore invalidate a lot of the results. In any matter, I would prefer to see more information on how the analyses are performed and some of the other summary statistics from the regression(s).
All in all informative, but I think it would add credence to their analysis if they were more forthcoming in how they performed it (they could even add it in an appendix if they are too concerned with ‘confusing the masses’).
LikeLike
Does this imply that the days of “buy and hold” are over?
LikeLike
Yes. Vitaliy Katsenelson‘s excellent The Little Book of Sideways Markets explains why.
LikeLike
I understand these returns are inflation-adjusted, but really I think you need to look at VOLATILITY-adjusted returns. This is especially worthwhile if you can index them to the price of gold–though I prefer copper (for obvious reasons).
Until you’re willing to do this–and I have to be honest here–you may as well be looking at the bones of a chicken.
LikeLike
Would you please share a link to some overview research.
LikeLike
[…] The physics of investing in overvalued markets. (Greenbackd) […]
LikeLike