AQR’s Cliff Asness released in November last year a great piece called, “An Old Friend: The Stock Market’s Shiller P/E (.pdf)” dealing with some of the “current controversy” around the Shiller PE, most notably that the real earnings used in the Shiller PE are lower than they would otherwise be because of two serious earnings recessions: the tail end of the 2000-2002 recession, and the monster 2008 financial crisis.
The Shiller P/E represents what an investor pays for the last 10 years’ average real S&P 500 earnings. The ten-year average is believed to be a more stable measure than a P/E based on a single year of earnings, and therefore more predictive of long-term future stock returns and earnings. Asness notes that the selection of a ten-year average is arbitrary (“You would be hard-pressed to find a theoretical argument favoring it over, say, nine or 12 years”), but believes that it is “reasonable and intuitive.”
Asness asks, “[W]hy do some people dismiss today’s high Shiller P/E, saying it’s not a problem? Why do they forecast much higher long-term real stock returns than implied by the Shiller P/E?”:
They point out that we had two serious earnings recessions recently (though only the tail end of the 2000-2002 event makes it into today’s Shiller P/E), including one that was a doozy following the 2008 financial crisis.
…
So we have to ask ourselves, is the argument against using the Shiller P/E today right? Are the past 10 years of real earnings too low to be meaningful going forward (meaning the current Shiller P/E is biased too high)?
Asness shows the following chart of a rolling average of 10-year real S&P 500 earnings (a backwards looking 10-year average):
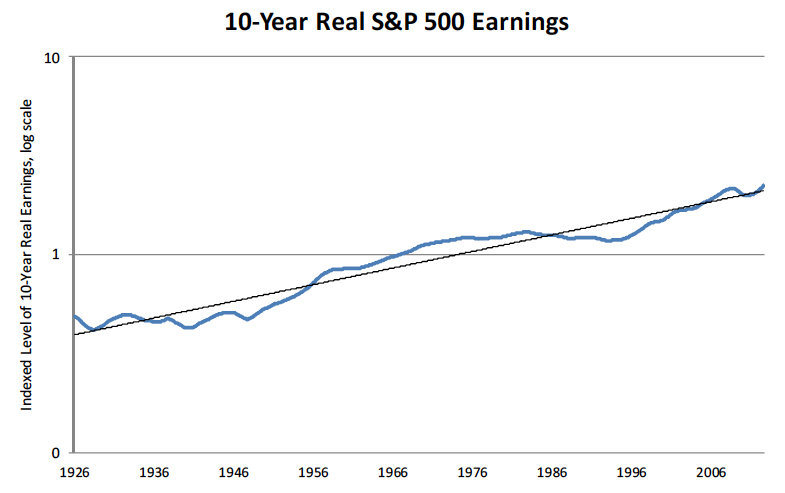
The chart demonstrates that 10-year real earnings used in the Shiller P/E are currently slightly above their long-term trend. At their low after the financial crisis, they fell back to approximately long-term trend. Asness comments:
It has not, in fact, been a bad prior decade for real earnings! The core argument of today’s Shiller P/E critics is just wrong.
While the graph speaks for itself, there is some logic to go with the picture. Critics of the Shiller P/E point to the earnings destruction right after 2008 and ask how we can average in that period and think we have a meaningful number? After all, aren’t we averaging in a once-in-a-hundred-year event? But they usually do not object at all to the very high earnings, for several years, right before the bubble popped in 2008. One view of earnings is that the 2008 event stands alone. It didn’t have to happen, and doesn’t have relevance to the future and should be excluded from our calculations lest it bias us to be sour pusses. That is not my view (granted I’m a bit biased to sour puss in general). Another very different view is that the earnings destruction post 2008 was making up for some earnings that, for several years prior, were “too high”, essentially borrowed from the future. In this case, the post 2008 destruction is valid for inclusion as it’s simply correcting a past wrong. Rather than invalidate the Shiller method, the 2008 earnings destruction following the prior earnings boom is precisely why the CAPE was created! Not surprisingly I fall into this latter camp.
I think the above graph is a TKO. Those who say the Shiller P/E is currently “broken” have been knocked out.
So, according to Cliff Asness, despite the recessions in 2000-2002 and 2008, the real ten-year average of earnings used in the Shiller PE is slightly above its long-term trend. Note that the current Shiller PE multiple of 23.5 is also about 42 percent above its long-term average of 16.5. Together, these two observations make the market look very expensive indeed.
Read An Old Friend: The Stock Market’s Shiller P/E (.pdf).
Order Quantitative Value from Wiley Finance, Amazon, or Barnes and Noble.
Click here if you’d like to read more on Quantitative Value, or connect with me on LinkedIn.


[…] also be volatile from a year to year basis. The criticism of Shiller P/E on the other hand is that 10 years as a period to average out earnings is too long since serious earnings recessions that hap…. A range would give a better […]
LikeLike
[…] ironic that the chief argument of the critics, their big gun that I address exhaustively above [from the earlier post], is that the last 10 years are just too disastrous to be meaningful (recall they are actually […]
LikeLike
[…] Click here to read earlier articles on Asness, AQR’s Value Strategies In Practice or On The Great Shiller PE Controversy: Are Cyclically-Adjusted Earnings Below The Long-Term Trend?. […]
LikeLike
[…] Greenbackd recently (see 73-Year Chart Comparing Estimated Shiller PE Returns to Actual Returns, On The Great Shiller PE Controversy: Are Cyclically-Adjusted Earnings Below The Long-Term Trend? and How accurate is the Shiller PE as a forecasting tool? What backtested returns does the […]
LikeLike
Personally, I currently accept the fate that stocks will produce poor returns. The real question is whether or not that should push you to the sidelines. Clearly investing in the index is fairly risky right now, as long term returns are likely to be poor, but that leaves you with 2 potential possibilities. Markets crash, and then potentially offer double digit returns… Or we actually experience small fluctuations eventually leading to the dismal 3% long term returns suggested by the models. In the former case, sitting on the sidelines with cash appears attractive at current levels, but what about the latter?
To me the prudent thing to do is to follow what actually is cheap. Instead of sitting on cash waiting for a crash scenario to play out, I’m into foreign stocks, typical netnet plays (domestic and foreign), microcap magic formula style candidates, etc. and beaten down financials. This could be foolish indeed, as potentially suggested by Ken, but there are cheap stocks and cheap markets out there.
I brought up Shiller PE and Tobin Q to Aswath Damadaoran on his blog. I pointed him to some reading material on your own site, as well as Hussman’s and Faber’s. It appears he comes to the conclusion that on a relative basis US Stocks are correctly priced…. while on an absolute basis it appears he accepts that Shiller and Tobin models point to poor returns. His response to me was simply that he has to deal with the hand dealt. Market Returns may not be good, but the sidelines aren’t either. The Hussman approach of sidelining oneself could put you money either unless a crash rebound style scenario were to play out. Personally I’d rather accept normalizing profit margins on US indices and search for deep value and across the globe.
http://aswathdamodaran.blogspot.ca/2013/03/a-sweet-spot-for-us-equities.html
LikeLike
This is a great question, and really gets to the heart of why investing is particularly difficult now. I’ve posted this below, but the answer is the same: James Montier calls it the “age of financial repression.” See his piece, “The 13th Labour of Hercules: Capital Preservation in the Age of Financial Repression” on the GMO research page here. I point to it because Montier outlines the two ugly alternatives:
He then asks, “What if my choice is wrong?”:
Damodaran’s model leans more to the first choice, and my favored metrics lean more to the second. The difference between the models I favor, and Damodaran’s, is that mine assume mean reversion, while Damaodaran’s assumes that present conditions persist. This is exactly the choice set out by Montier. Which is correct? Frankly, only time will tell. My bet is on mean reversion…eventually, so the bet that present conditions persist is not so different. Note, however, that the mean reversion bet has historically been a good one..eventually (for example, see my new post “73-Year Chart Comparing Estimated Shiller PE Returns to Actual Returns“). I’d like to see how predictive the DCF analyses have been historically. I suspect a DCF analysis sends the wrong signal at important points. For example:
1. In 1964 low interest rates and high profitability implied a high market value calculated via DCF. The market started a secular bear 1966 that ended in 1982.
2. In 1981 high interest rates and low profitability implied a low market value calculated via DCF. The market started an 18-year secular bull in 1982.
The ratios I favor (Shiller PE, equity q, and total market capitalization-to-GNP) got these pivotal points correct…eventually.
LikeLike
[…] this week I posted about the current controversy around the cyclically-adjusted earnings in the Shiller PE, most notably that the real earnings used in the Shiller PE are lower than they would otherwise […]
LikeLike
I submit there are NO valid price signals (P/B, P/E, TBV, etc.) to determine intrinsic value to aid capital investment while the Federal Reserve distorts the entire economy with:
1- negative real after inflation interest rates and
2 – increases the monetary base by multiples with unlimitied quantitave easing for the bond market (ie; QE4-EVA).
Until these items are corrected, it is all pixie-dust and flying unicorns (that is to say fantasy)
Now, more than ever, I believe investing defensively with large margins of safety is in order.
P.S. – Love your work and analysis on this blog and online video.
LikeLike
Thank you. I’ve got a lot of sympathy for that view. I’ve commented elsewhere on this, but I’ll reproduce it here, and eventually turn it into a post: James Montier calls it the “age of financial repression.” See his piece, “The 13th Labour of Hercules: Capital Preservation in the Age of Financial Repression” on the GMO research page here. I point to it because Montier outlines the two ugly alternatives:
He then asks, “What if my choice is wrong?”:
LikeLike
Investors are looking for any excuse to be fully invested. This is what happens near market tops. You must discredit any evidence that the market is overvalued in order to rationalize continued investment at high valuations.
LikeLike
Agreed. Three long-term ratios (total market capitalization-to-GNP, Tobin’s q, and the Shiller PE) point to overvaluation in the order 45+ percent.
LikeLike